
by Miklos Zagoni
Eotvos Lorand University
Budapest, Hungary
miklos.zagoni@earthenergyflows.com

 |
Earth's
Energy Flows by Miklos Zagoni Eotvos Lorand University Budapest, Hungary miklos.zagoni@earthenergyflows.com |
 |
|
Observations, Recognitions,
Explanations
— Integer structures were
observed in Earth's annual global mean energy flow system
— These integer ratios are solutions of four radiative transfer constraint relationships — These relationships are consequences of the long-known Schwarzschild equations CONTENT
I. INTRODUCTION We
found four equations for the Earth's annual global mean energy
flow system — two for the clear-sky, two for the all-sky; one pair for
the net radiation at the surface and one pair for the total
(absorbed and emitted) energy at the surface —, coupling surface
fluxes directly to top-of-atmosphere (TOA) fluxes, namely, to outgoing
longwave radiation (OLR) and the longwave cloud radiative effect
(LWCRE). On NASA CERES satellite-based observational datasets (EBAF
Edition 4.1, Version 3, 22-year global means from April 2000 through
March 2022), the individual bias of the equations is less than ±3 Wm-2
and
the mean bias of the four equations is 0.0007 Wm-2.
On this page I will demonstrate that these four equations are immediate consequences of the simplest greenhouse geometry as described by, for example, Dennis Hartmann's Global Physical Climatology (1994, 2016, Cambridge), or, most recently, Kevin E. Trenberth's "The Changing Flow of Energy Through the Climate System" (2022, Cambridge). • I
will show that the fundamental equations given
by Dennis Hartmann and Kevin Trenberth to describe their model are
directly related to Karl
Schwarzschild's (1906) two-stream radiative transfer equation.
• I
will point out that the geometric model represents the simplest
arithmetic ratios of 1 :
2 : 3 : 4, or their extended version, 1 : 2 : 3 : 4 : 6 : 8. I
will prove on published datasets that the Earth's global mean
clear-sky energy flow system accurately satisfies these ratios.
• I
will prove that this
clear-sky integer system can be extended to the all-sky in one
single step. By using the longwave cloud radiative
effect (LWCRE at TOA) as one unit, the
all-sky energy flow system also reveals a simple integer ratio
structure, with small integers as multiples of LWCRE. This system
satisfies the four equations far within observational uncertainty.
I will demonstrate that the first of these four equations comes from Schwarzschild's original (1906) two-stream radiative transfer equation and has been consistently reproduced in standard university textbooks on atmospheric physics and radiation — from Goody (1964, 1989, Oxford) to Houghton (1977, 1986, 2002, Cambridge) and Ambaum (2021, RMetSoc) — but is notably absent from all the climate change literature, including studies and assessments from Manabe-Strickler (1964) and Manabe-Wetherald (1967) to the IPCC reports (1990–2021).
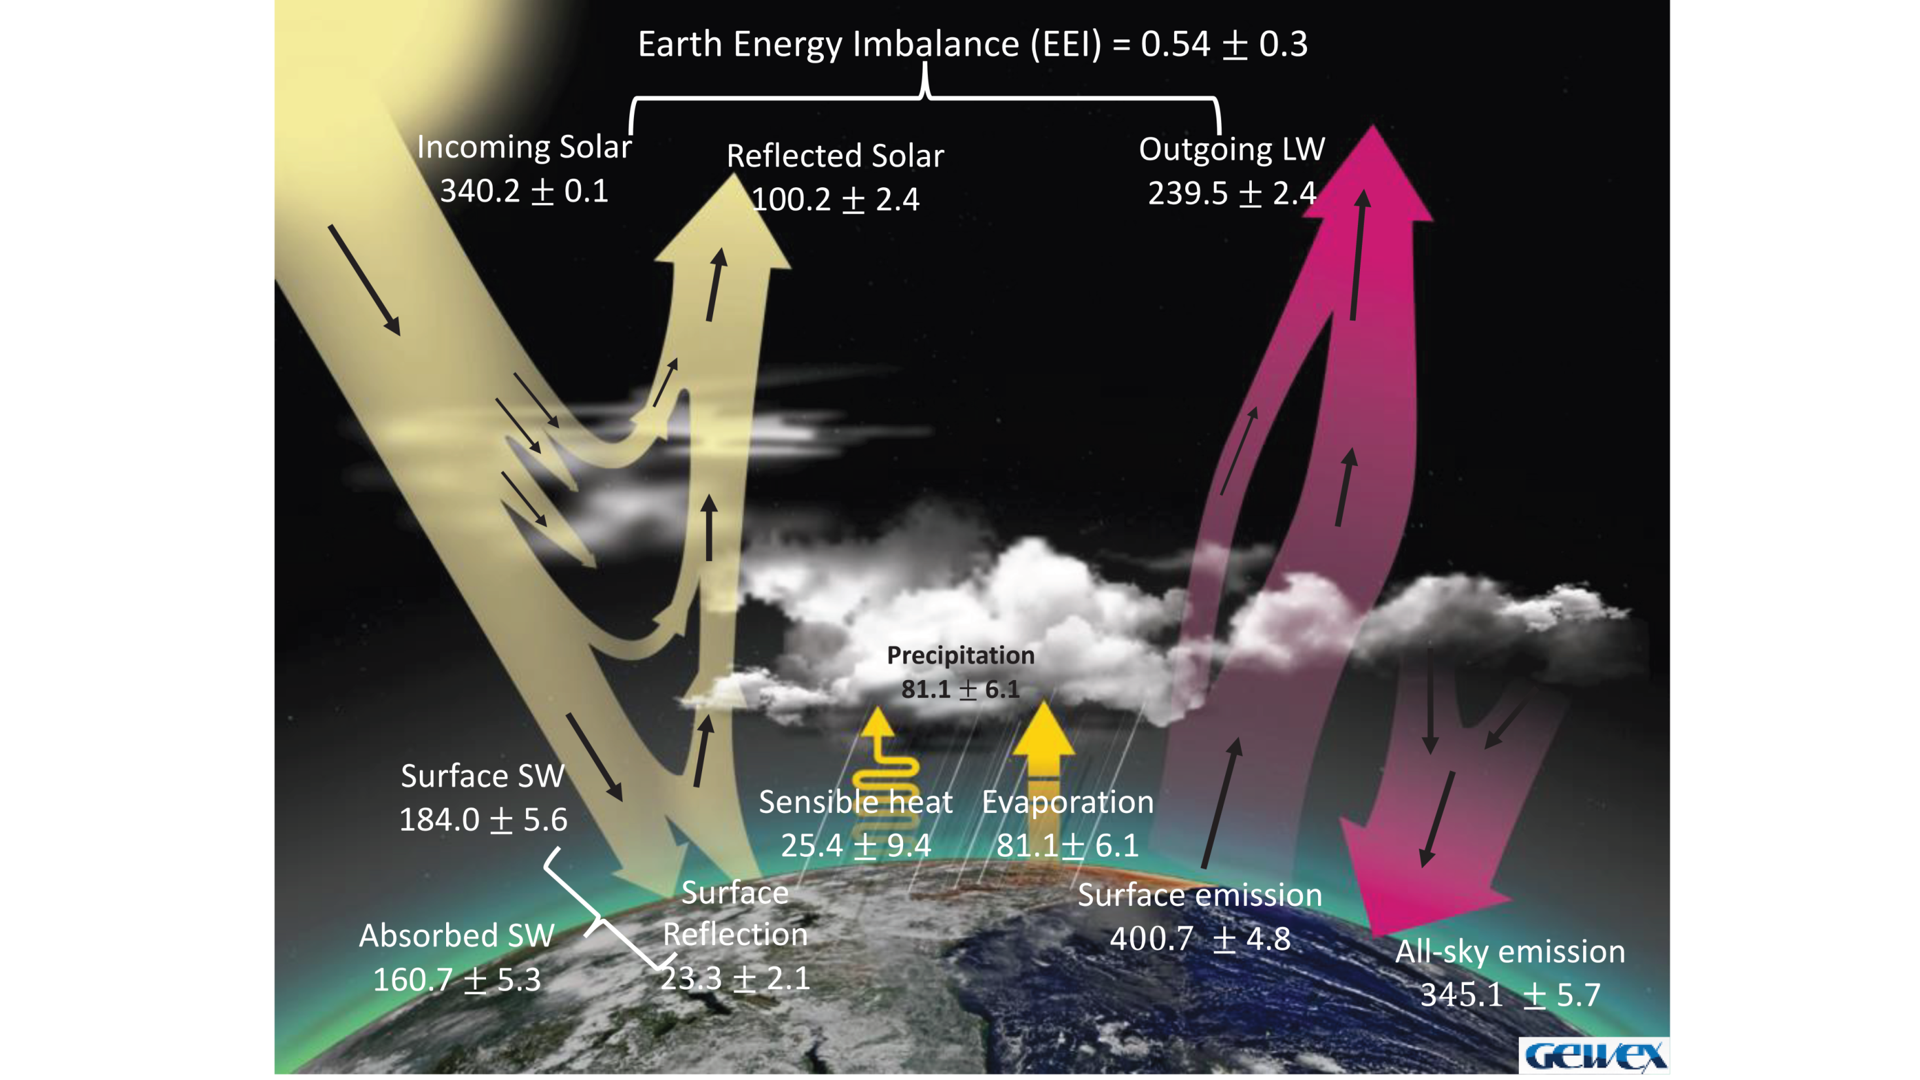 Fig.1 Integer sturctures and the two all-sky equations in Stephens et al. (2023, BAMS) GEWEX data
The historical development of my observations followed a reverse order. I first identified integer ratio systems in published global mean all-sky energy budget assessments (e.g., Stevens and Schwarz 2012; Stephens et al. 2012; Wild et al. 2013; Loeb, 2014), then in the clear-sky CERES EBAF (2016) datasets. I then located the corresponding equations in the history of radiative transfer (e.g., Schwarzschild, 1906) and validated the system using recent data from GEWEX (2023), NASA CERES (2024), and CMIP6 (2024). Encountering Dr. Trenberth's greenhouse geometry in his recent book was a significant and confirming moment. NASA
CERES Earth's Global Mean Energy Budget
Each energy flow component is within the stated range of uncertainty. Differences shown in circles (Wm-2). Difference at TOA = 0.0 Wm-2. Largest difference: Reflected at Surface, also Sensible Heat: 2.67 Wm-2. [Notice the extremely interesting feature that the TOA fluxes are integers on the cross-section disk to incoming solar radiation.]  Fig.2 Integer sturctures in NASA CERES EBAF data (Loeb et al.) II.
Deduction of the first two (clear-sky) equations
from the simplest greenhouse model Here
I show the simplest derivation of the first two equations from the
simplest
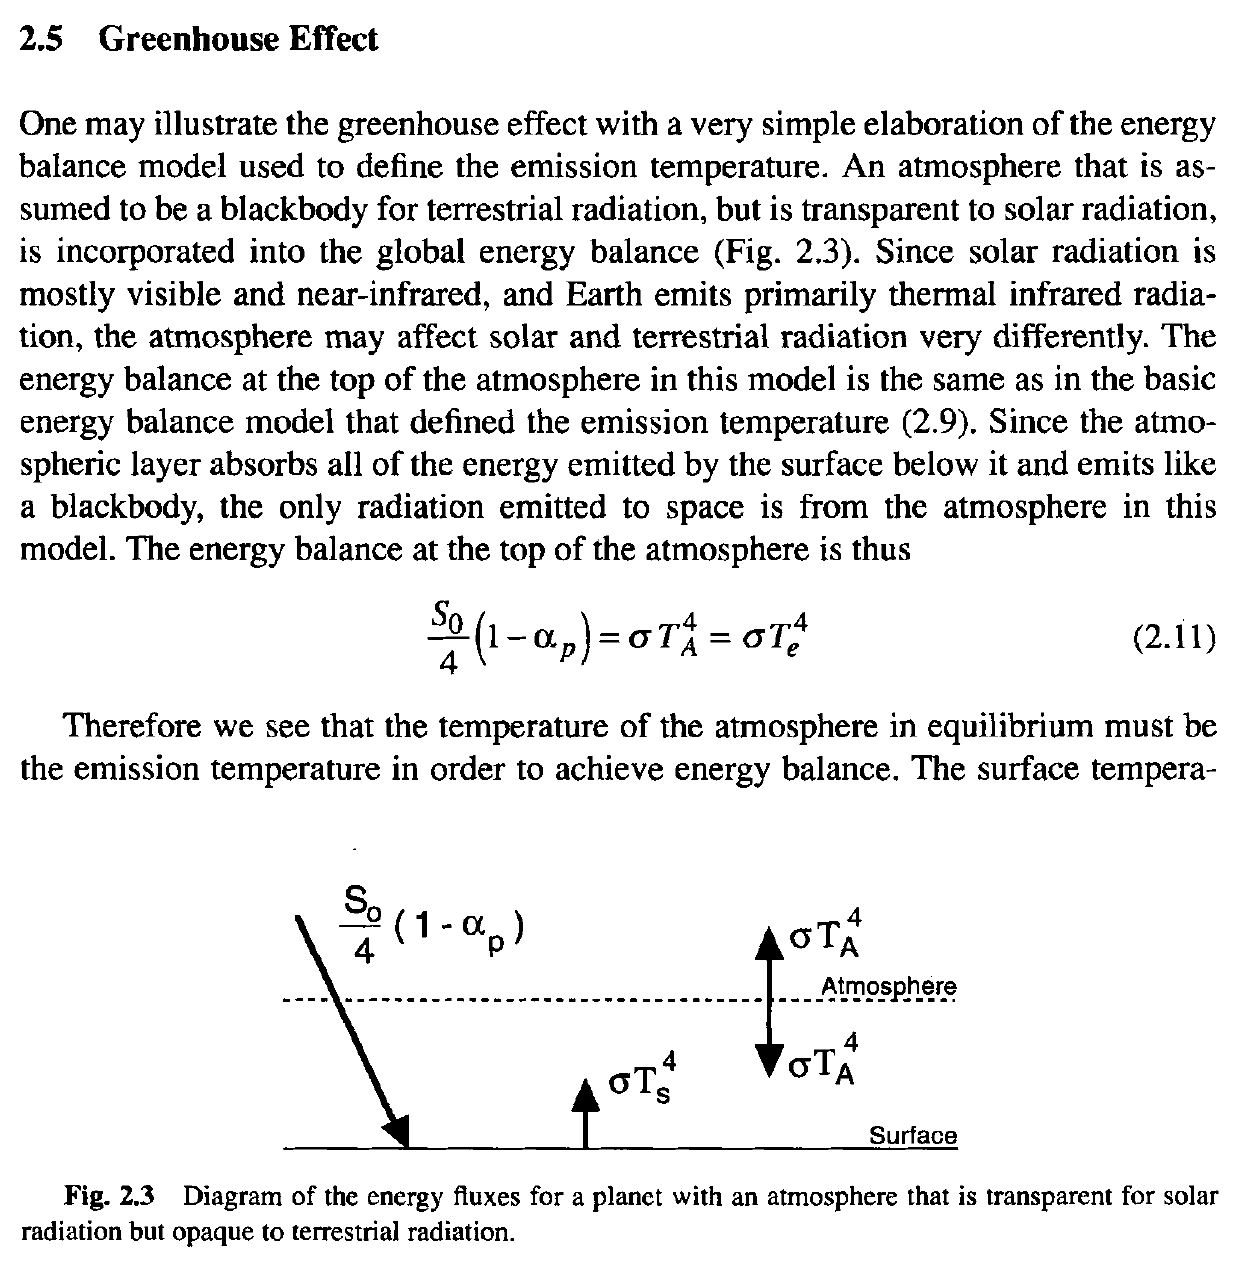
greenhouse model (Dennis Hartmann: Global Physical Climatology 1977,
2016, Chapter 2, Fig. 2.3)
  In
his (2.12) we see our Equation (2):
Eq.
(2)
σTS4 =
2σTe4 . "A thin layer of atmosphere near the surface absorbs a fraction ε of the emission from above and below and emits in both directions. The temperature of the air adjacent to the surface, TSA, may be derived from the energy balance there."
εσTS4
+ εσTA4 = 2εσTSA4
. we have 3σTe4 = 2σTSA4 , that is σTSA4 = (3/2)σTe4 , and Eq. (1) σTS4 – σTSA4 = σTe4 /2. Eq. (1) describes the net radiation at the surface, generating convection, being equal half of the effective emission (OLR/2) in the clear-sky.Eq. (2) describes the total (shortwave plus longwave) absorbed radiation at the surface; equals the total emitted (radiative plus convective) flux from the surface. Their difference desribes upward longwave (ULW) emission from the surface, An early validation, With σTe4 = OLR (outgoing longwave radiation at TOA), CERES EBAF 192 monthly means: the difference in Eq. (1) is 0.60 Wm-2, in Eq. (2), 0.59 Wm-2 and ULW = (3/2)OLR within 0.0 Wm-2. (ULW = 398.40 Wm-2, OLR(clear) =265.59 Wm-2; 398.40 = 1.5 × 265.59 – 0.015). Hartmann, Chapter 3 extends the model into an atmosphere with two layers; equations added. 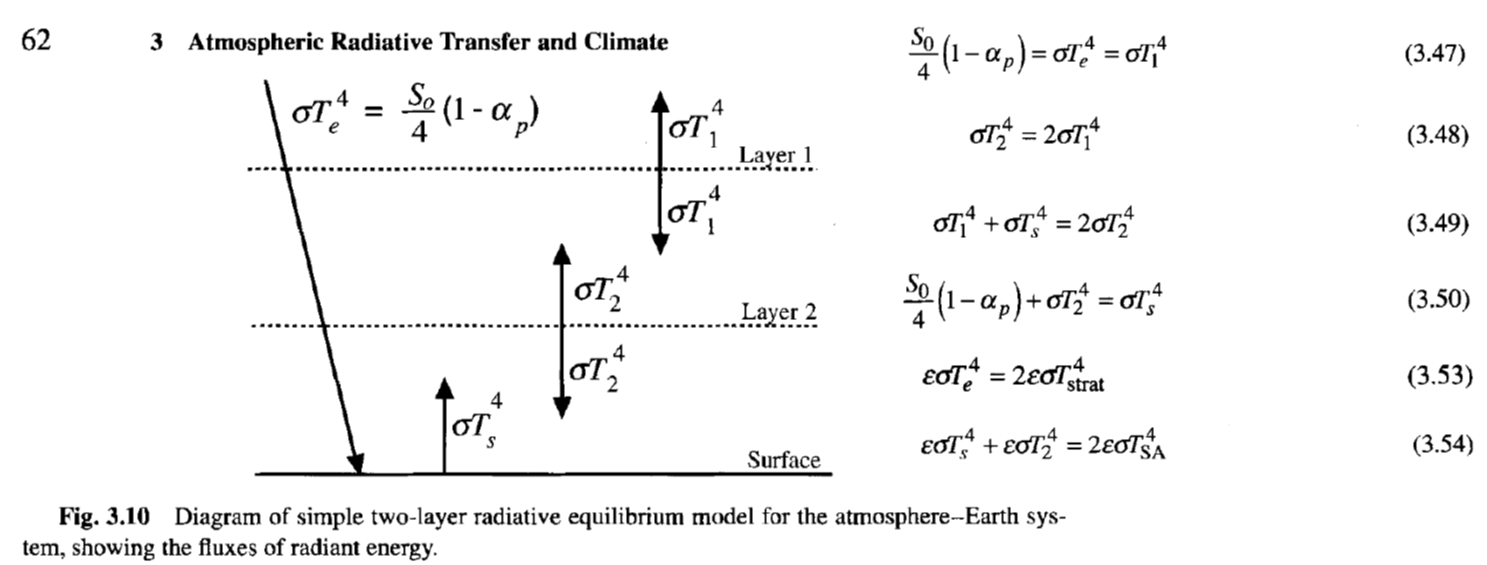 "At
the top of the atmosphere we must have energy balance, Eq. (3.47). We
thus know immediately that the top layer temperature must equal the
emission temperature
of the planet, since, in this approximation, the only longwave emission
that
escapes to space comes from the upper layer. The energy balance at
layer 1 is
Eq. (3.48). The balance at layer 2 yields Eq. (3.49). And the balance
at the
surface is Eq. (3.50). (…) If the atmosphere absorbs no solar
radiation, the
energy balance for a thin layer of emissivity E at the top of the
atmosphere is
between absorption of the flux of terrestrial radiation from below and
the
emission from the layer itself Eq. (3.53). A thin
layer of atmosphere
near the surface absorbs a fraction ε of the
emission from above and
below and emits in both directions. The temperature of the air adjacent
to the
surface, TSA, may be derived from the energy
balance there (Eq.
3.54)",
Our Eq. (1) follows again in the same form: Eq. (1) σTS4 – σTSA4 = σTe4 /2. but here σTS4 = 3σTe4 . CERES data do not support this equality. It may be concluded here that the Earth's atmosphere follows the single-layer atmospheric geometry, where : Eq. (2) σTS4 = 2σTe4 . The all-sky pair of equations are generated from these two clear-sky equations (RN for the net radiation at the surface, balanced by convection, and RT, the total SW+LW absorbed radiation at the surface, balanced by the radiative and non-tadiative [convective] emission by the surface), by separating atmospheric radiation transfer from the longwave cloud effect (LWCRE): Eq.
(1)
RN
(clear) = OLR(clear)/2
Eq.
(2)
RT
(clear) = 2OLR(clear)
Eq.
(3)
RN
(all) = [OLR(all) – LWCRE]/2
Eq.
(4)
RT
(all) = 2OLR(all) + LWCRE.
Notice that the clear-sky pair of equations represents the RN
: OLR
: ULW
: RT
=
1
: 2 : 3 : 4
integer ratio system. Using again σTSA4 = ULW (Upward Longwave radiation at the surface), being equal both in all-sky and clear-sky, and OLR(clear-sky) = OLR(all-sky) + LWCRE by definition, LWCRE
: RN(all)
:
OLR(all) : ULW
: RT(all)
= 1 : 4 : 9 : 15 : 19
and, expressing the clear-sky ratios in red (LWCRE = 1) units as well, RN(clear)
: OLR(clear)
: ULW
: RT(clear)
=
1 : 2 : 3 :
4 = 5 : 10 : 15 : 20.
Projecting the two all-sky equations and their integer solution on Hartmann (2016, Figure 2.4), using LWCRE from the book as 26 Wm-2 as 1 unit (shown in red bold typeface), Eq. (3) is valid with a difference of 1.5 Wm-2; Eq. (4) is exact (0.0 Wm-2 difference). In Eq. (3), convective fluxes (Thermals and Latent heat) are used, as shown above. Reflected solar radiation at TOA (100), Solar radiation absorbed by atmosphere (80), and Solar radiation absorbed by surface (160) are also accurate. 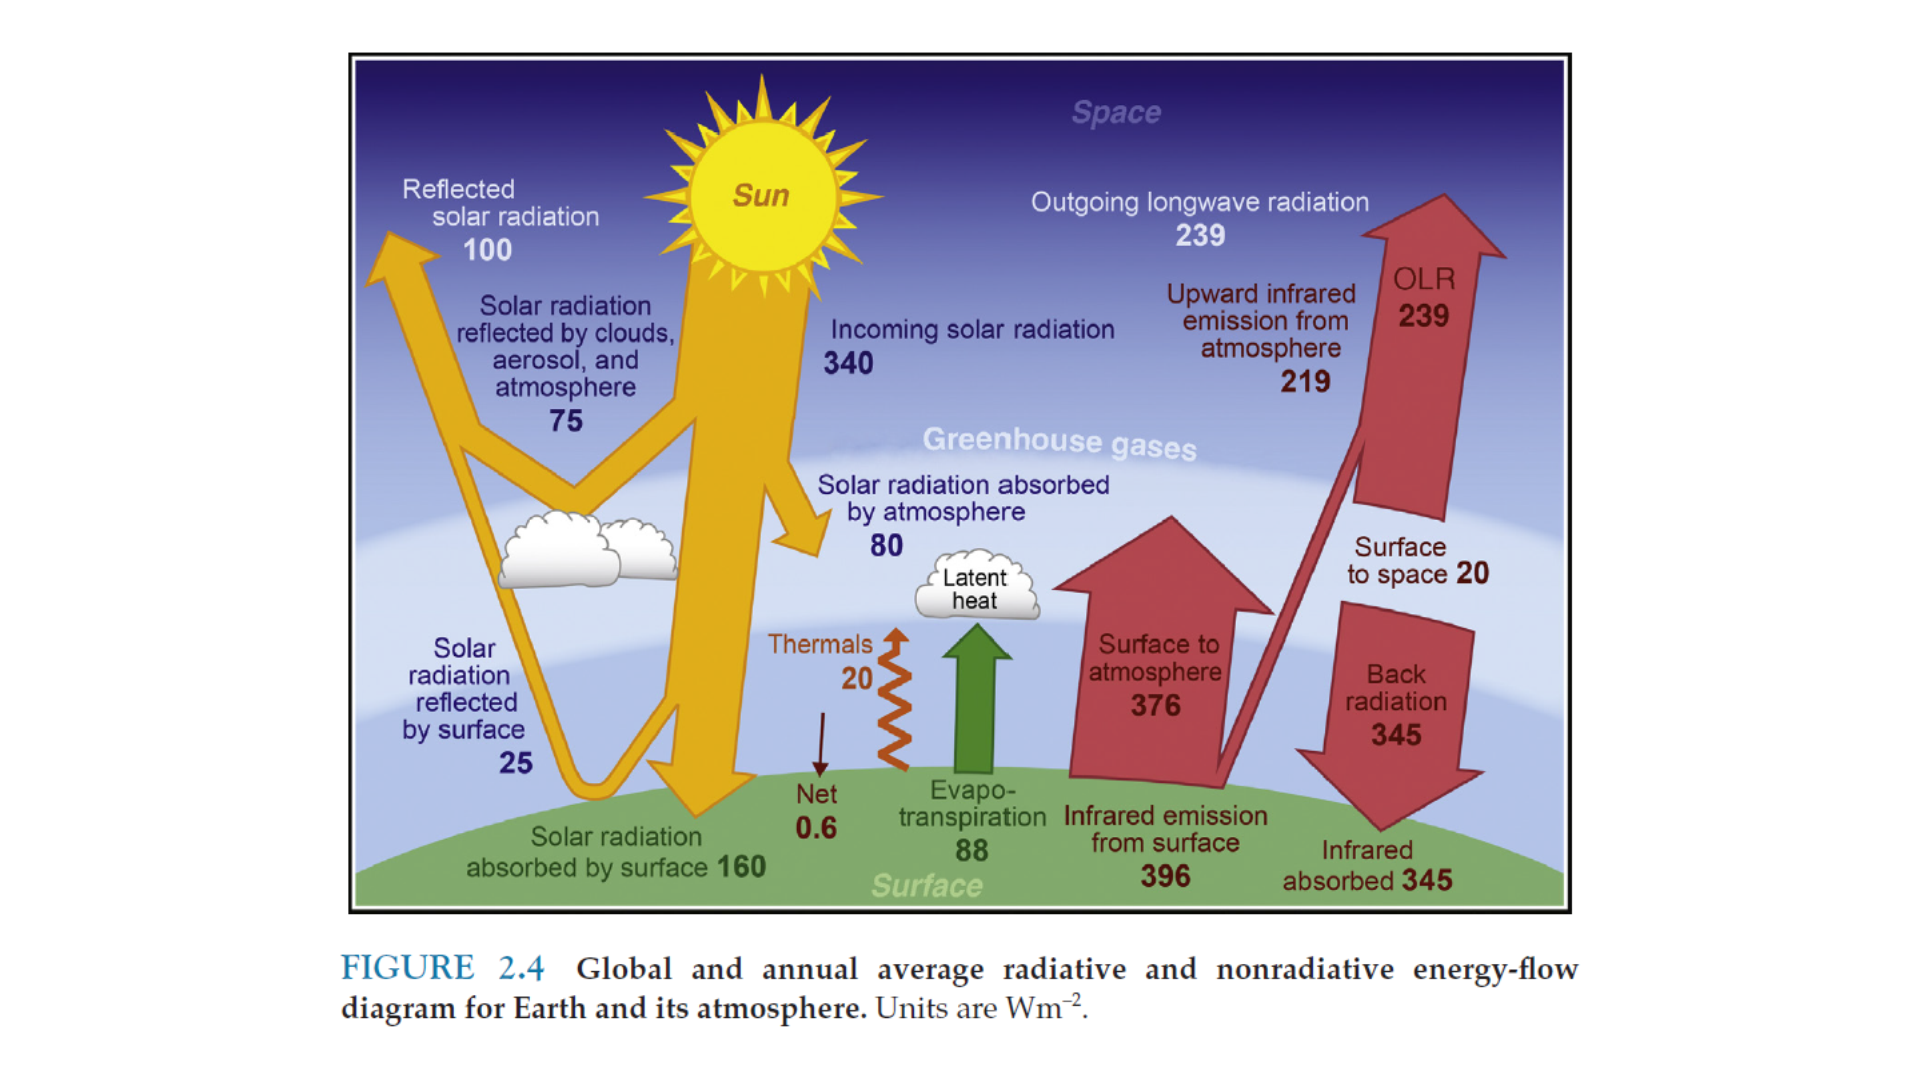 It will be shown that the clear-sky pair of equations comes directly from Schwarzschild's (1906, Eq. 11) two-stream radiative transfer equation:  Using that terminology, the total radiation at the surface, SFC Tot = RT = A, the net radiation at the surface SFC Net = RN = A – E = ΔA, SFC LW up = ULW = E and TOA LW = OLR = A0, 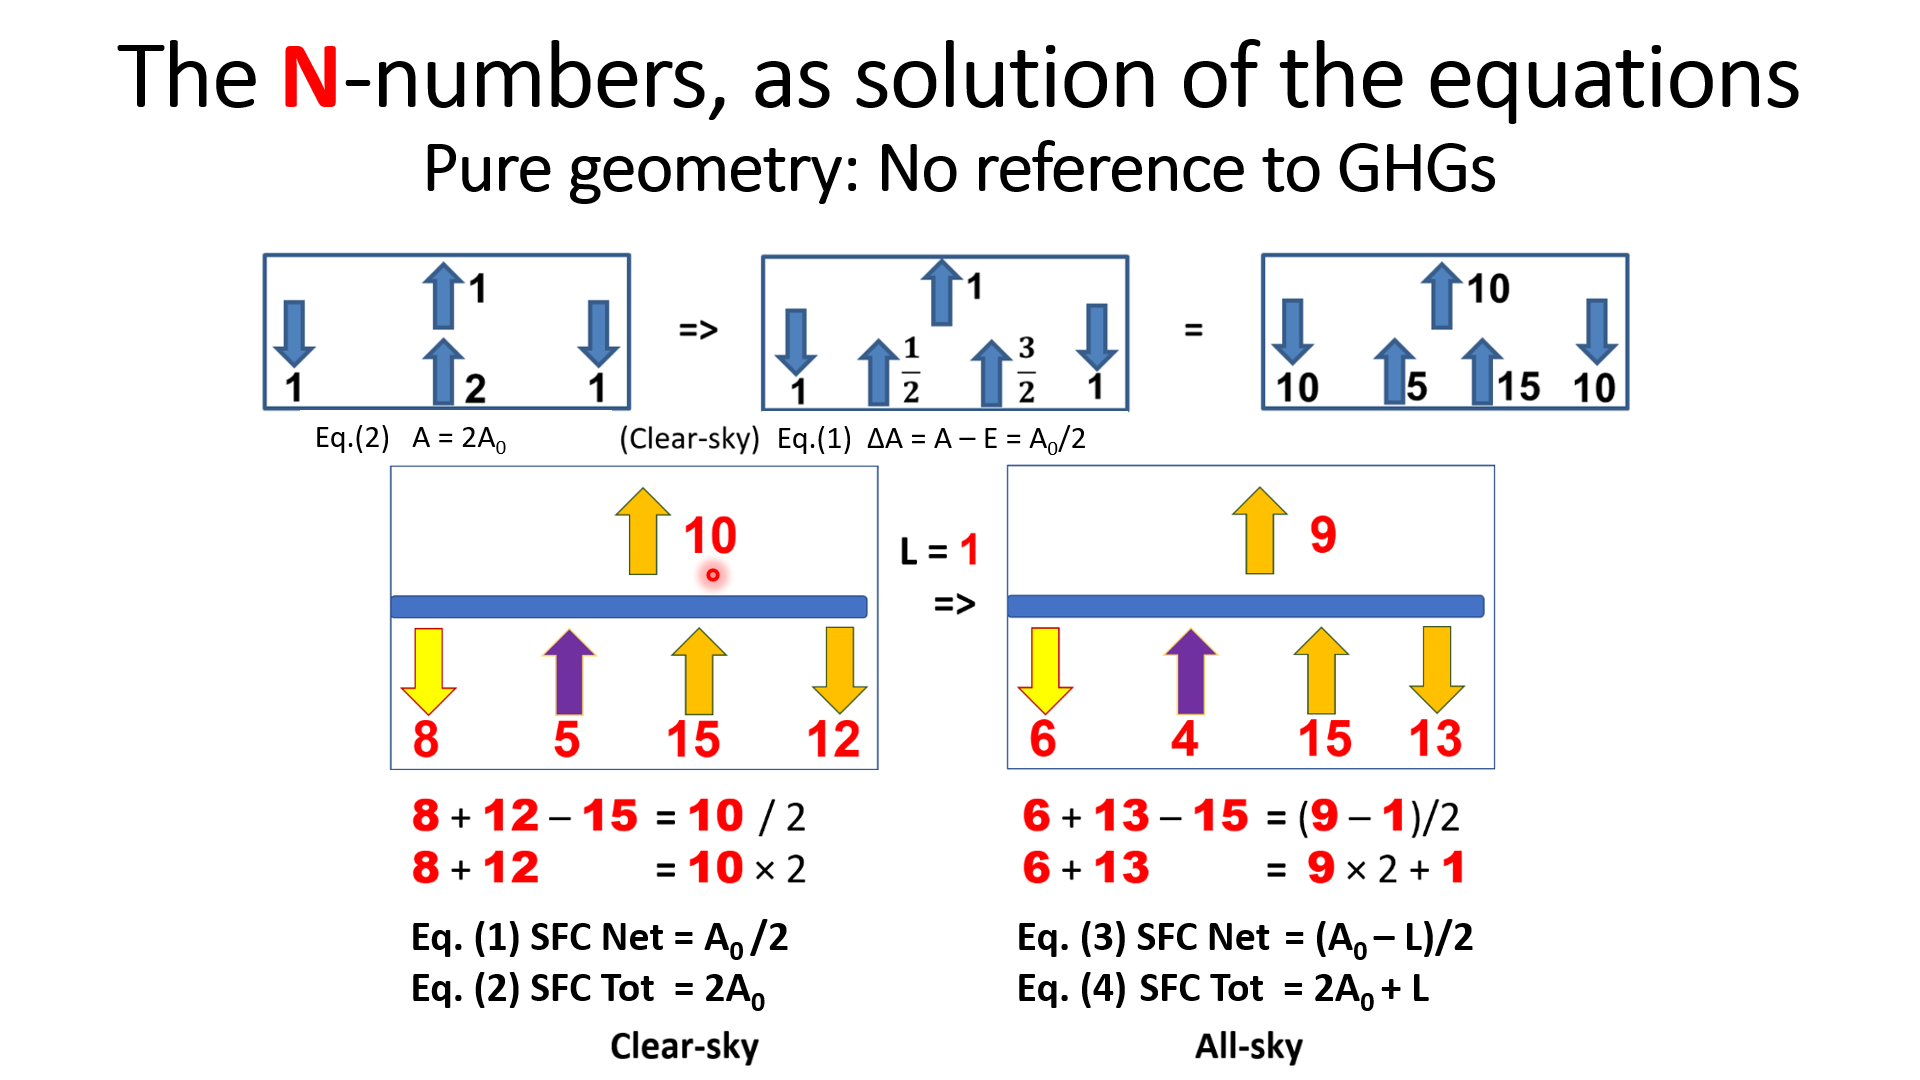 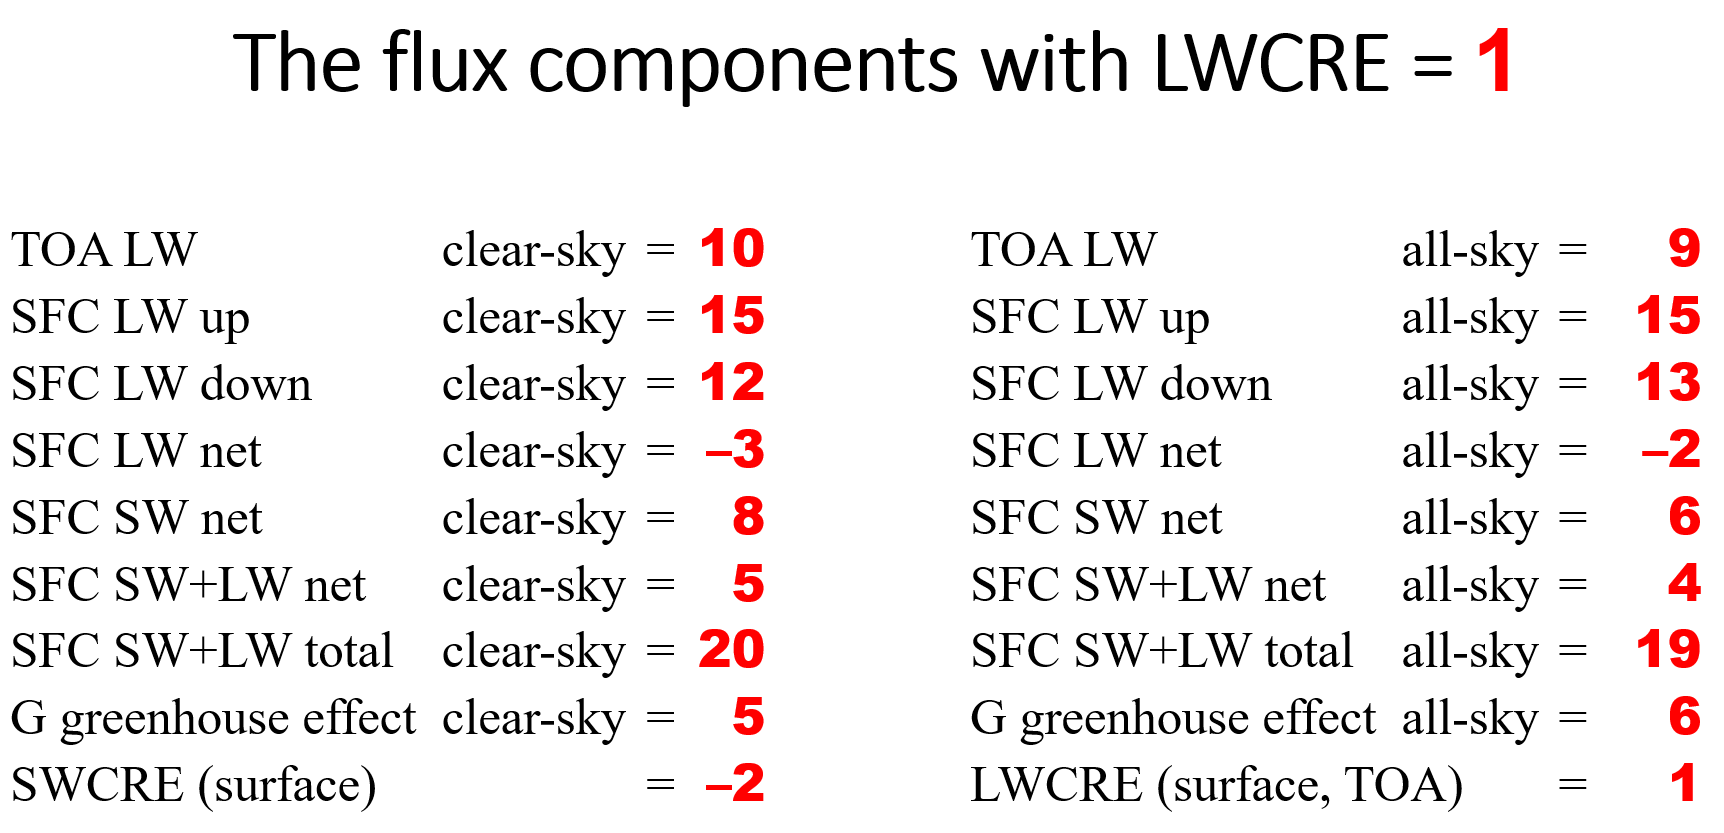 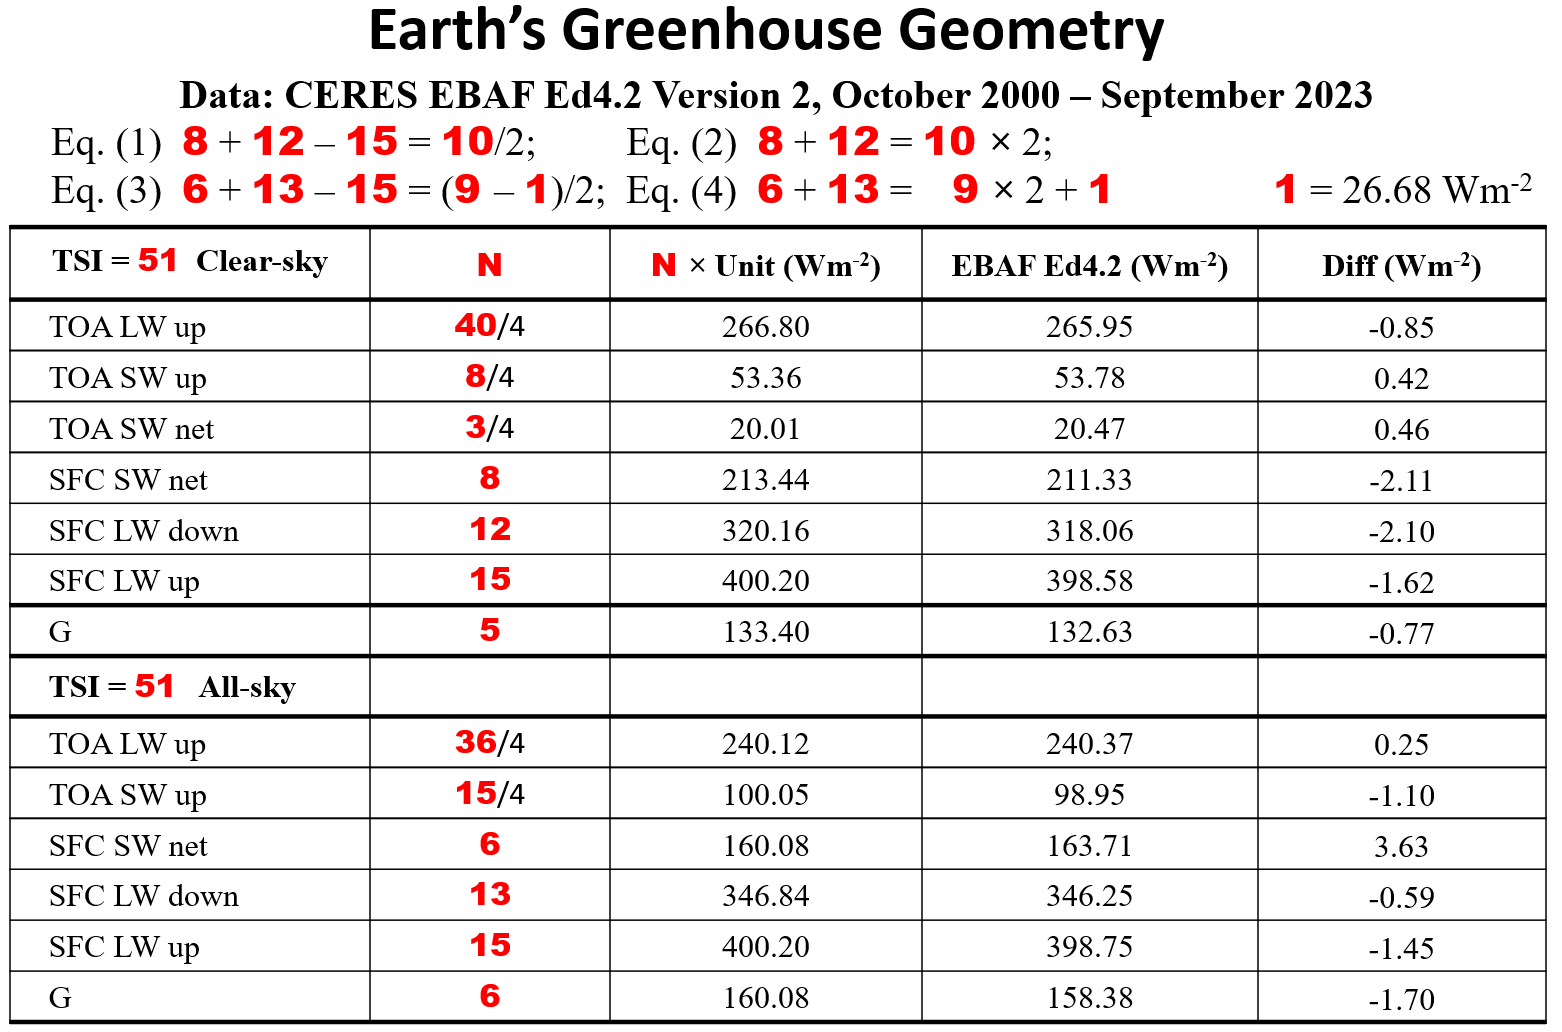 The largest difference from the integer position in clear-sky is 2.11 Wm-2, in all-sky 3.63 Wm-2. CERES instrument calibration error is 4.2 Wm-2; CERES observed TOA flux uncertainty is ±2 Wm-2, CERES computed surface flux uncertainty is between ±2 Wm-2 and ±4 Wm-2 (Kato et al. 2018). Integer positions and CERES data are consistent within uncertainty. A case study: clear-sky greenhouse effect In the integer system, the clear-sky greenhouse effect is G = SFC LW up – TOA LW up = 15 – 10 = 5 = 133.40 Wm-2. An independent estimate: GFDL Atmospheric Model 4, G = 133.4 ± 0.6 Wm-2. 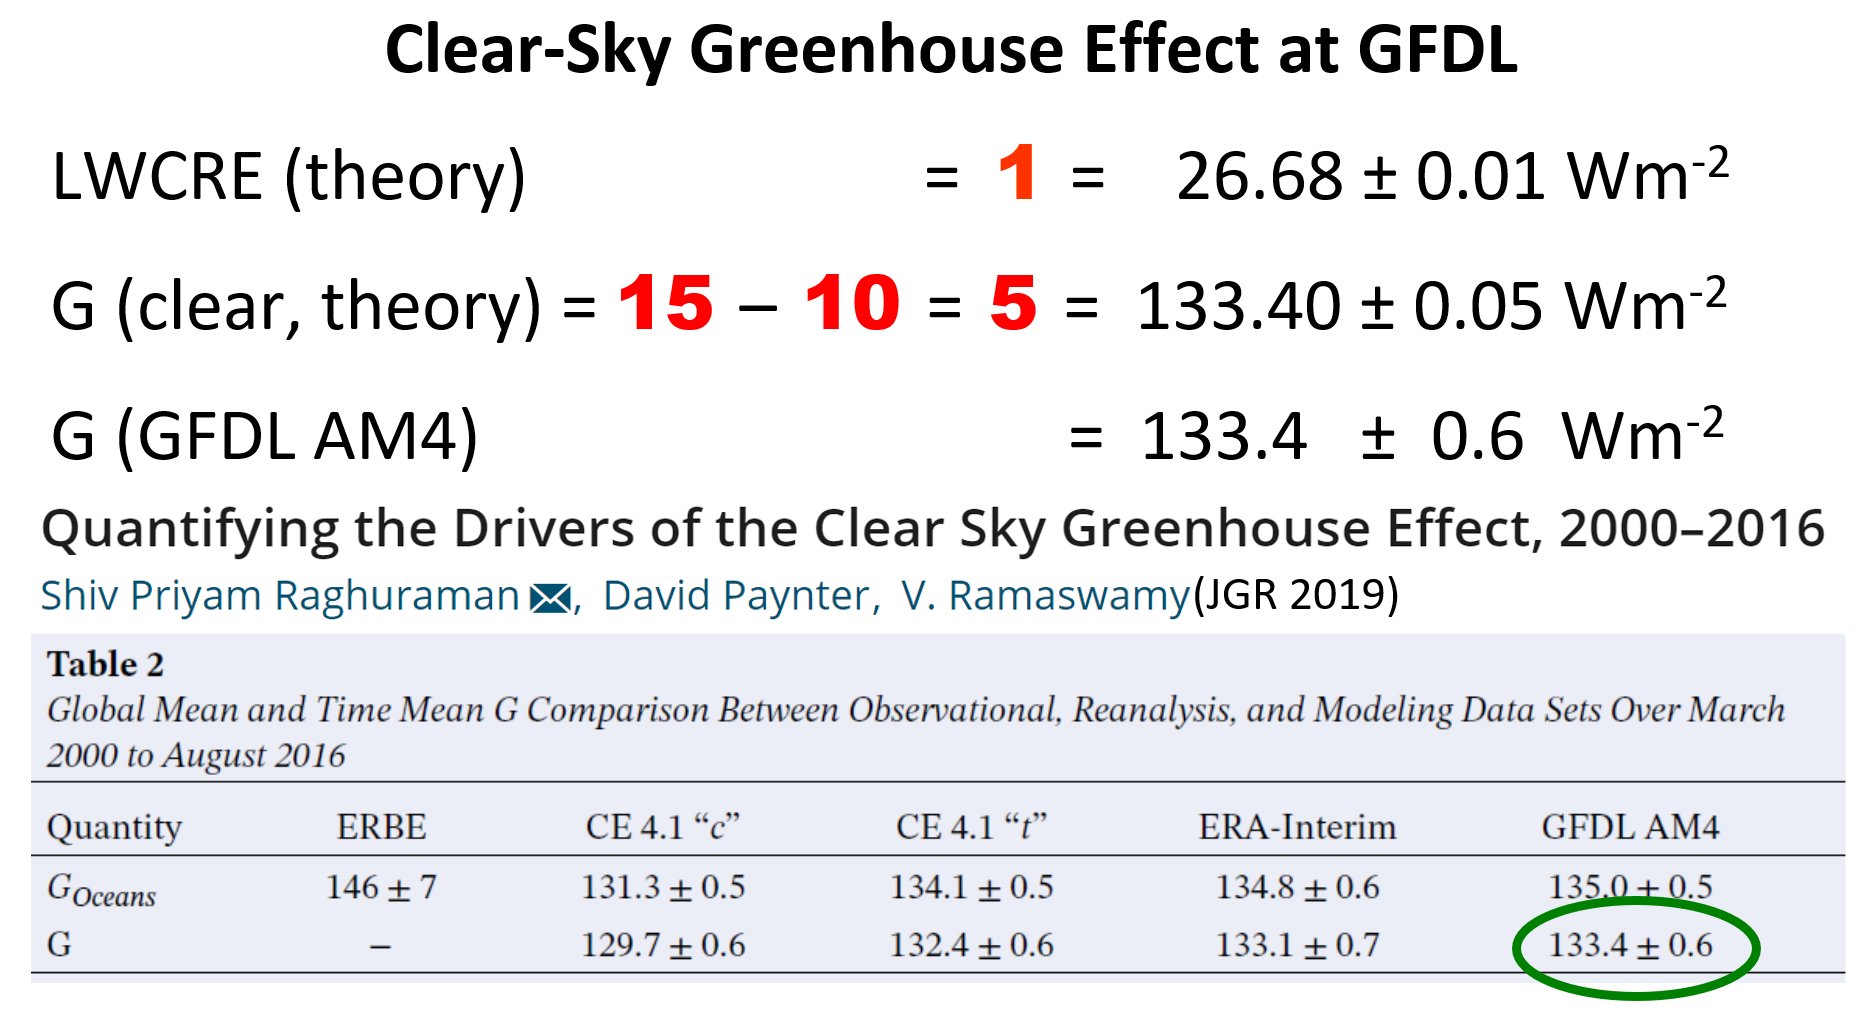 The theoretical greenhouse-gas independent geometric clear-sky greenhouse factor is g = G / (SFC LW up) = 5 / 15 = 1/3. According to the most recent CERES EBAF Ed4.2 (24-yr) mean: g = (398.85 – 265.98) / 398.85 = 0.333. 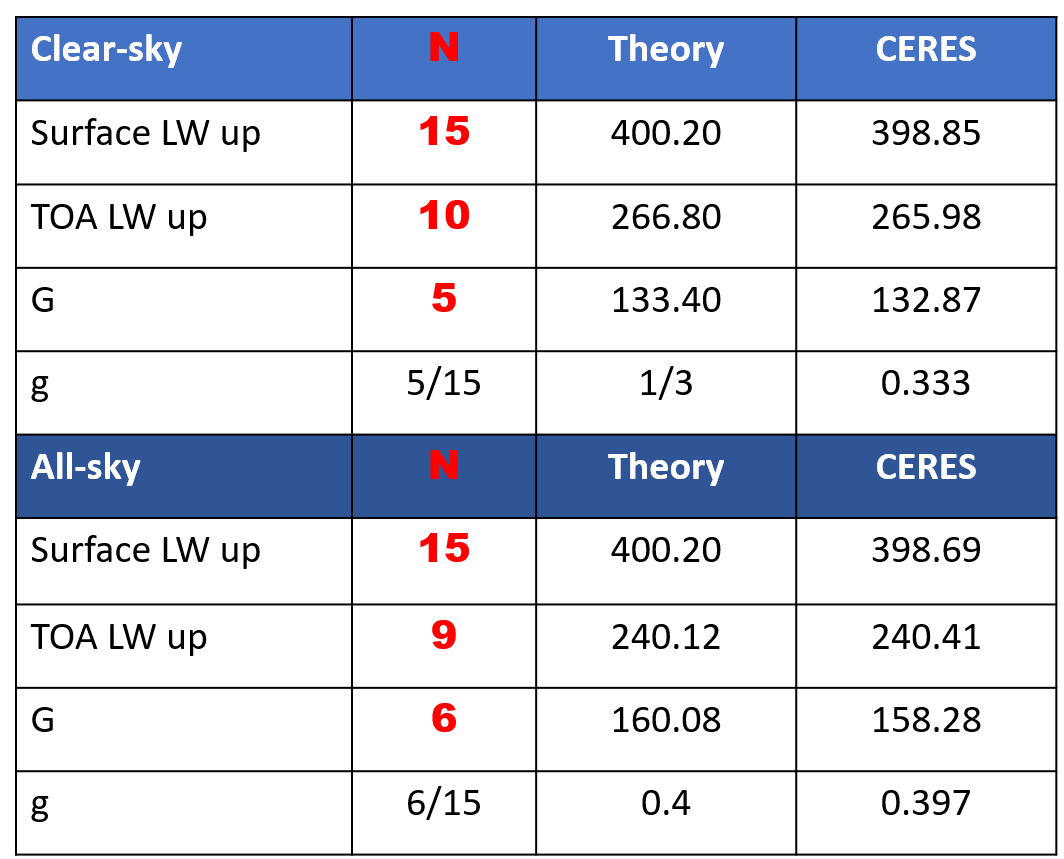 In the Earth's special surface-atmosphere system, where a practically infinite deposit of condensed greenhouse gases (water vapor) is available in the surface of the oceans, and where convection is controlled by strict radiative transfer constraints on the net radiation at the surface, the clear-sky greenhouse factor sits exactly on its prescribed GHG-independent theoretical geometric position, suggesting that recent warming is not greenhouse warming. HISTORICAL INTRODUCTION (Max Planck Institute, Hamburg) Observations reveal integer ratios between the components of Earth's global mean energy flow system Observing and Modeling Earth's Energy Flows — Twelve Years Later (video, 39:46) THEORY (THE PHYSICAL SCIENCE BASIS) The integer ratios are solution of four basic radiation transfer equations Trenberth's Greenhouse Geometry I.(video,
1:16:09)
IMPLICATIONS, INTERPRETATIONS, SPECULATIONS The validity of the equations has far-reaching consequences Trenberth's Greenhouse Geometry II,: Implications (video, 1:11:21) AMS 2025 ANNUAL MEETING (New Orleans, Poster 1) The clear-sky equations are equivalent to Dr Trenberth's Earth's-like geometric greenhouse model Trenberth's Greenhouse Geometry and its Representation on the Earth's Atmosphere (Poster) AMS 2025 ANNUAL MEETING (New Orleans, Poster 2) There is a long-known equation constraining convection A Constraint on Convection (Poster) AGU 2024 FALL MEETING (Washington, iPoster 1) Gewex data verify the all-sky equations by very high accuracy Modeling and Observing Global Energy and Water Cycles by GEWEX (iPoster) Abstract (pdf) AGU 2024 FALL MEETING (Washington, iPoster 2) A valid radiative tranfer constraint equation on convection is omitted from climate models What's Next for Science: Theoretical Understanding of Atmospheric Convection on Global Scales (iPoster) EGU 2024 GENERAL ASSEMBLY (Vienna, talk) Dr Trenberth's greenhouse model is an accurate description of Earth's global mean clear-sky energy flow system Trenberth's (2022) Greenhouse Geometry (EGU talk) NASA CERES SCIENCE TEAM MEETING (Washington, talk) The fundamental integer relationships presented to NASA in 2017 Patterns in the CERES Global Mean Data (2017 NASA GSFC) EARTH RADIATION BUDGET WORKSHOP / NASA CERES-Libera Science Team Meeting talk (Hamburg, pdf) Updated CERES observations verify the equations and their integer solution accurately Observing and Modeling Earth's Energy Flows, Ten Years Later (Max Planck Institute, Hamburg, Germany, 2022) (pdf) AGU 2021 Fall Meeting iPoster https://agu2021fallmeeting-agu.ipostersessions.com/default.aspx?s=BC-5C-80-85-7C-F7-AF-C1-6C-12-83-4B-1D-AC-46-AA&guestview=true AGU 2020 Fall Meeting iPoster https://agu2020fallmeeting-agu.ipostersessions.com/default.aspx?s=BD-5D-34-45-A3-93-F7-C1-40-CA-81-80-4F-97-74-E1&guestview=true AMS 2021 Annual Meeting https://ams.confex.com/ams/101ANNUAL/meetingapp.cgi/Paper/376937 EGU 2021 General Assemby https://earthenergyflows.com/Sir_John_Houghton_on_radiation_transfer-by-Miklos_Zagoni_v720.mp4 EGU 2022 General Assembly https://earthenergyflows.com/EGU22-49_livePresentation_15-music.mp4 EGU 2024 GENERAL ASSEMBLY (Vienna, talk) Dr Trenberth's greenhouse model is an accurate description of Earth's global mean clear-sky energy flow system Trenberth's (2022) Greenhouse Geometry (EGU talk) EGU 2025 General Assembly https://earthenergyflows.com/EGU25-1-print.pdf (submitted) EGU 2025 submission updated supplementary material: Theoretical Reference Estimate TRE20.pdf https://earthenergyflows.com/TRE20.pdf CERES 2025 Spring Science Team Meeting https://earthenergyflows.com/Ed421_Data_vs_Theory.pdf (planned) https://earthenergyflows.com/Ed421_Data_vs_Theory-2025_Spring_STM-Zagoni-v06-vids.mp4 (pre-recorded video) AMS 2025 San Diego https://earthenergyflows.com/AMS-SanDiego-Zagoni-submitted.pdf (submitted) DRAFT Observing and Modeling Earth's Energy Flows, Thirteen Years Later https://earthenergyflows.com/ObsMod13.pdf IV. HISTORY My first encounter with the integer system: Stephens et al. (2012, Nature Geosci.) (video, 4 min) * * * The second, next year: Wild et al. (2013, Clim.Dyn., IPCC AR5) (video, 3 min) * * * The third, next year: Loeb (2014, NASA CERES) (video, 1 min) V. THEORY, PART 1. TRENBERTH'S GREENHOUSE GEOMETRY (video, 18:32) THEORY, PART 2. EQUATIONS (video, 20 min) THEORY, PART 3. GEOMETRIC DEDUCTION (video, 9 min) For more of the theory, see the full video: Trenberth's Greenhouse Geometry, The Physical Science Basis VI. BOTTOM LINE / TAKE AWAY Stephens et al. (2023, GEWEX, BAMS), Wild et al. (2024 Nature Comm.,), CERES (2024) (video, 2 min 20 sec) * * * VII. A note on Total Solar Irradiance (as the basis of the unit flux):   * * * VIII. CERES EBAF Edition 4.2.1 (released 11/25/2024) 24 running years 288 montly global means (Oct 2000 - Sept 2024) Only last 36 months are displayed. Click to enlarge and download  Schwarzschild, K. (1906) Ueber das Gleichgewicht der Sonnenatmosphäre. Nachrichten von der Königlichen Gesellschaft der Wissenschaften zu Göttingen. Mathematisch-physikalische Klasse. The original two-stream approximation of the radiation transfer problem in a gray atmosphere in local thermodynamic equilibrium. Equation (11) gives the emission of a layer E (for example, the surface), the upward beam A and the downward beam B as a function of the emerging flux at the top-of-atmosphere A0 and the gray ‘optische Masse’ (optical depth) m. — The difference of the upward beam and the emission of the layer gives a net radiation which is constant (independent of the optical depth) and equals half of the emerging flux. Emden, R. (1913) Über Strahlungsgleichgewicht und atmosphärische Strahlung. Sitzungsberichte der mathematisch-physikalischen Klasse der Königlich Bayerischen Akademie der Wissenschaften zu München. English translation: Radiation equilibrium and atmospheric radiation, by H. Bateman. Monthly Weather Review (1916). Emden realized that in Schwarzschild’s (1906, Eq. 11) there is a discontinuity of the Planck-function at the surface in radiative equilibrium, requiring a temperature discontinuity at the surface in radiative equilibrium; but within the same sentence he is added that this “jump” (Temperatursprung) is greatly diminished by evaporation of water and conduction; this way establishing the concept of radiative-convective equilibrium. The paper computes correctly the size (magnitude) of the temperature jump (20°C), but does not display explicitly the constraint on it (A0/2). Schwarzschild, K. (1914) Über Diffusion und Absorption in der Sonnenatmosphäre. Sitzungsberichte der Königlichen Preussischen Akademie der Wissenschaften, Berlin. Vorgelegt von Hrn. Einstein. This paper gives the general solution of the radiative transfer problem in the form of differential equations. Milne, E.A. (1930) Thermodynamics of the Stars. Handbuch der Astrophysik, Vol. 3, Part 1. This book contains an elegant deduction of Schwarzschild’s (1906) plane-parallel (“linear”, “tubular”) solution from Schwarzschild’s (1914) general (differential and integral) equations. Schwarzschild (1906), (1914) and Milne (1930) was translated to English and published in Selected papers on the transfer of radiation, Donald H. Menzel, 1966. Dover Publ. Goody, R. (1964) Atmospheric radiation: Theoretical basis. Oxford University Press. Contains the deduction of the constant net radiation at the surface as equals half of the incoming solar (and outgoing longwave) flux Fs (Equation 2.115), noting that the jump always equals Fs/2. Manabe, S. and Möller, F. (1961) On the radiative equilibrium and the heat balance of the atmosphere. Monthly Weather Review, 89:12 Refer to Emden (1913), but not to Schwarzschild. Manabe, S. and Strickler, R. (1964) Thermal equilibrium of the atmosphere with a convective adjustment. Journal of the atmospheric Sciences, 21. Refer to Emden, but not to Schwarzschild. Compute correctly the magnitude of the temperature discontinuity, but do not mention the constraint on it. Manabe, S. and Wetherald, R. (1967) Thermal equilibrium of the atmosphere with a given distribution of relative humidity. Journal of the atmospheric Sciences, 24.3. Refer neither to Emden nor to Schwarzschild. Compute correctly the magnitude of the temperature discontinuity, but do not mention the constraint on it. Houghton, J. (1977) The physics of atmospheres. Cambridge University Press. 2nd and 3rd editions 1986, 2002. Equation 2.13 reproduces the net radiation at the surface as equals half of the emerging flux. Notes that the discontinuity in temperature in radiative equilibrium is destroyed by the process of convection, leading to radiative-convective equilibrium. Chamberlain, J. (1978, 2nd ed. 1987) Theory of planetary atmospheres. Academic Press. Eq. (1.2.29) and Fig. 1.4 explicitly show the discontinuity as F/2. Hartmann, D. (1994, 2nd ed. 2016) Global physical climatology. For its three-layer radiative equilibrium model, Eq. 3.51 gives the surface temperature and Eq. 3.54 the temperature of the air adjacent to the surface. Their difference is not displayed explicitly, but directly follows as σTS4 – σTSA4 = σTe4 /2. With its data, the difference is 0.31 Wm-2. Salby, M. (1996) Fundamentals of atmospheric physics. Academic Press. 2nd ed. 2012, Cambridge Univ. Press. Eq. 8.67 gives the net radiation at the surface equals F0/2. Visconti, G. (2001) Fundamentals of physics and chemistry of the atmosphere. Spinger Verlag. Eq. 3.49 gives the formula for the net radiation at the surface as half of the effective emission. Vardavas, I. and Taylor, F. (2007) Radiation and Climate. Oxford Univ. Press. “An atmosphere in radiative equilibrium (see Fig. 2.11) produces essentially a discontinuity (of about 20 K) between the Earth’s surface temperature and the near–surface atmospheric temperature”, equals f/2. Zdunkowski, W., Trautmann, T. and Bott, A (2008) Radiation in the Atmosphere. Cambridge Univ. Press. Fig. 6.7 shows the discontinuity. Pierrehumbert, R. (2008) Principles of Planetary Climate. Cambridge Univ. Press, Eq. 4.45 Andrews, D. (2010) An Introduction to Atmospheric Physics. Cambridge Univ. Press. Pp.85-86, Fig. 3.21. Ambaum, M. (2021): Thermal physics of the atmosphere. Royal Meteorological Society. Eq. 10.56. Temperature discontinuity, removed by turbulent heat exchange.
The theory is straightforward; is it true on observations? CERES EBAF Edition 2.8 global means 2000-2016: Net radiation at the surface = TOA LW up/2 – 0.59 Wm-2. CERES EBAF Edition 4.1 global means 2000-2024: Net radiation at the surface = TOA LW up/2 – 2.33 Wm-2. All-sky: Net radiation at the surface = (TOA LW up – LWCRE)/2 + 2.71 Wm-2. Mean bias of the two net equations: 0.19 Wm-2. All-sky version of the equation is valid on 30 years of GEWEX observation dataset with a difference of 0.1 Wm-2. Stephens, G. et al. (2023) The first 30 years of GEWEX. BAMS References where the equation is not there: All the follow-ups of the Manabe-approach The Charney report (1979) Theory of Climate (1983) (ed. B. Saltzman). Academic Press IPCC reports (1990-2021). For example, an ideal position to include it would have been in WGI AR5 (2013), Chapter 2.3 (Changes in Radiation Budgets), where said: “On average, radiative processes warm the surface and cool the atmosphere, which is balanced by the hydrological cycle and sensible heating.” Here to declare the constraint on the hydrological cycle and sensible heating as OLR/2 in clear-sky is necessary. NASA CERES Science page, Global Mean Energy Budget |
RESUME
I am Miklos Adam Zagoni.
Zagon is a small village in Transylvania, once in Hungary, now in Romania.
So my closest relatives must be Count Dracula and the Addams family.
And my far achestor is Attila, the Hun.
Page created by: Miklos
Zagoni
Contact: miklos.zagoni@earthenergyflows.com
IUS ERRORIS RESERVATUR