Overture

Dmitri Mendeleev
Recent surface and satellite measurement systems are accurate enough to realize that there are patterns in Earth's annual mean energy budget. All the fundamental fluxes – surface upward and downward longwave radiations, outgoing longwave radiation, atmospheric and surface absorbed solar radiations, and the turbulent fluxes – are integer multiples of a certain unit flux, which itself is an element of the global energy flow system.
This is not a hypothesis, this is observation. In this website we do not ask the reader to imagine or accept this or that climate theory; we ask to look and try. Anyone who looks at the published energy budget data sets is able to reproduce this observation. The pattern is there, and we will show it in different, independent publications. The accuracy of the measurements discloses the possibility of a mere coincidence: the fit of the values is not only approximative but very sharp. Later we will show that the fit, actually, is exact. There are ratios of integers.
This is interesting in iteslf. Another, even more interesting observation is that the surface energy budget is strictly connected to the energy flows at the top of the atmosphere. If you know the magnitude of the energy flows at the upper boundary of the atmosphere, you are able to tell the values of the energy flows at the lower boundary. This is not a hypothesis either, but an observed fact of the published energy budgets. Our method – again, as throughout in this website – is to look and try.
The first question is not why the pattern is there. The first quation is: how accurate is the fit of the observed data to the pattern. Therefore first we will show that the accuracy is much better than the measurement error of the observations. In other words, the published mean values of the fluxes are always closer to the prescribed integer multiple value than the one-sigma uncertainty range of the given flux element.
Though in this website we are not going to speculate about the possible theoretical interpretation of the found structure, we still show a physical model which might be able to explain both of these peculiar features: the specific pattern and the constrained character of the Earth's basic energy flows.
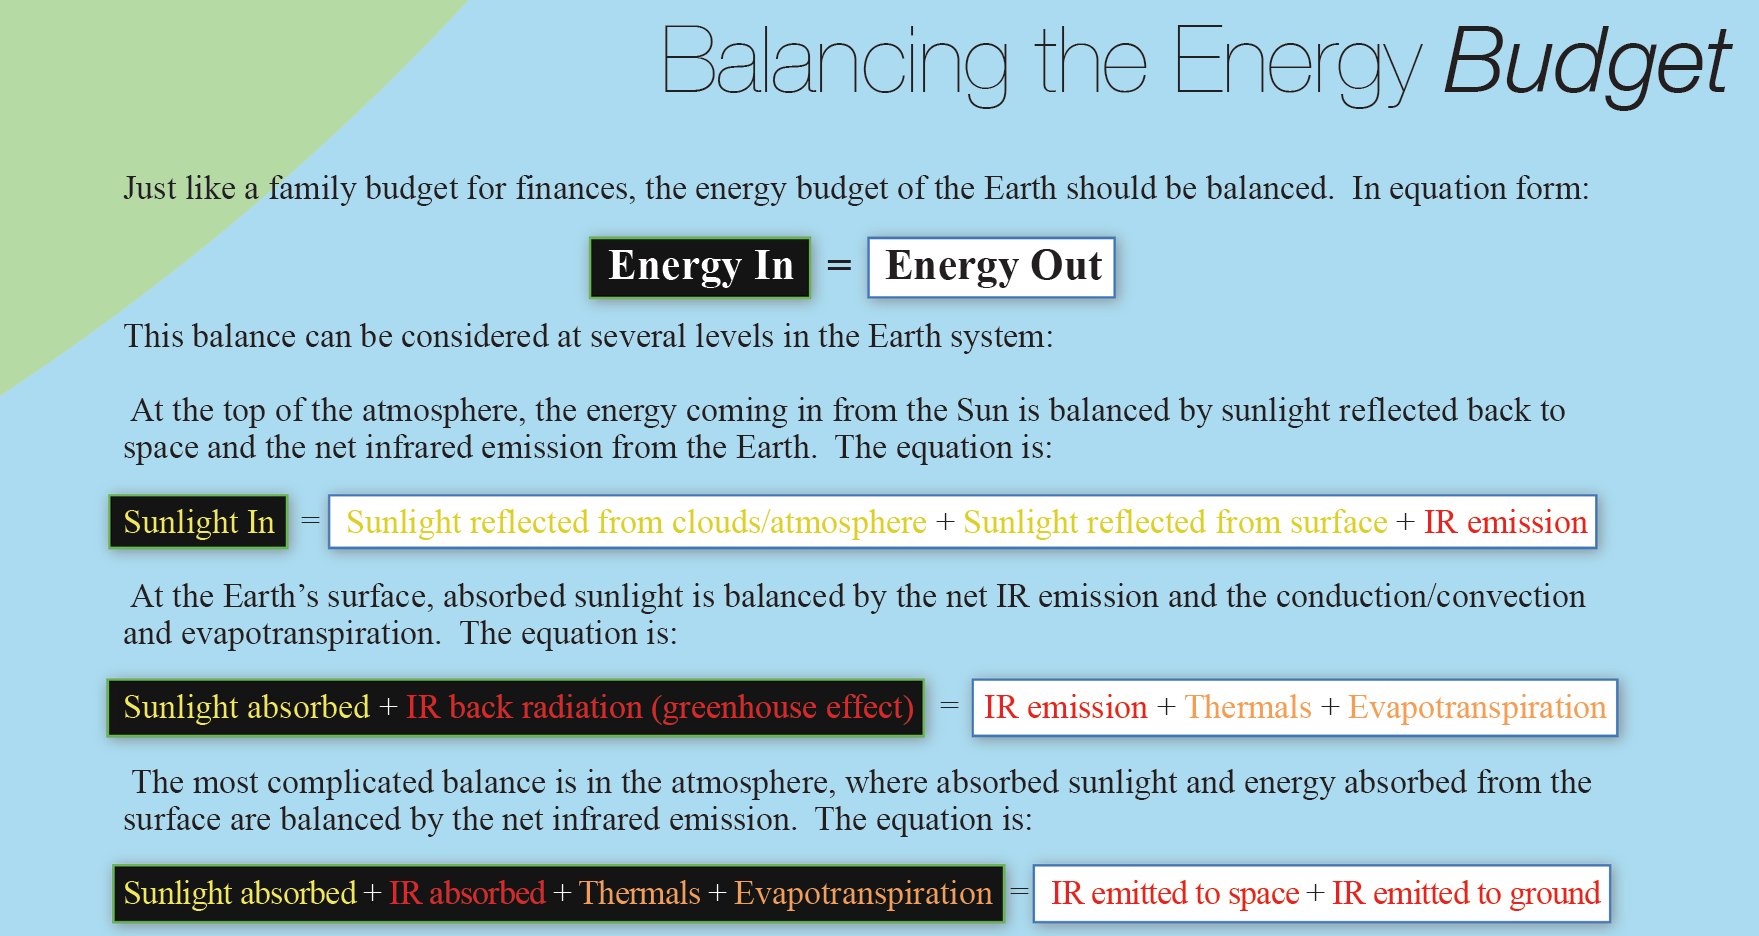
What are we talking about? The basic concepts: Global Energy Budget, as given for example in this NASA Langley Research Center's education poster, and the energy flows (fluxes) in it, as presented in tabulated forms and diagrams as shown below.
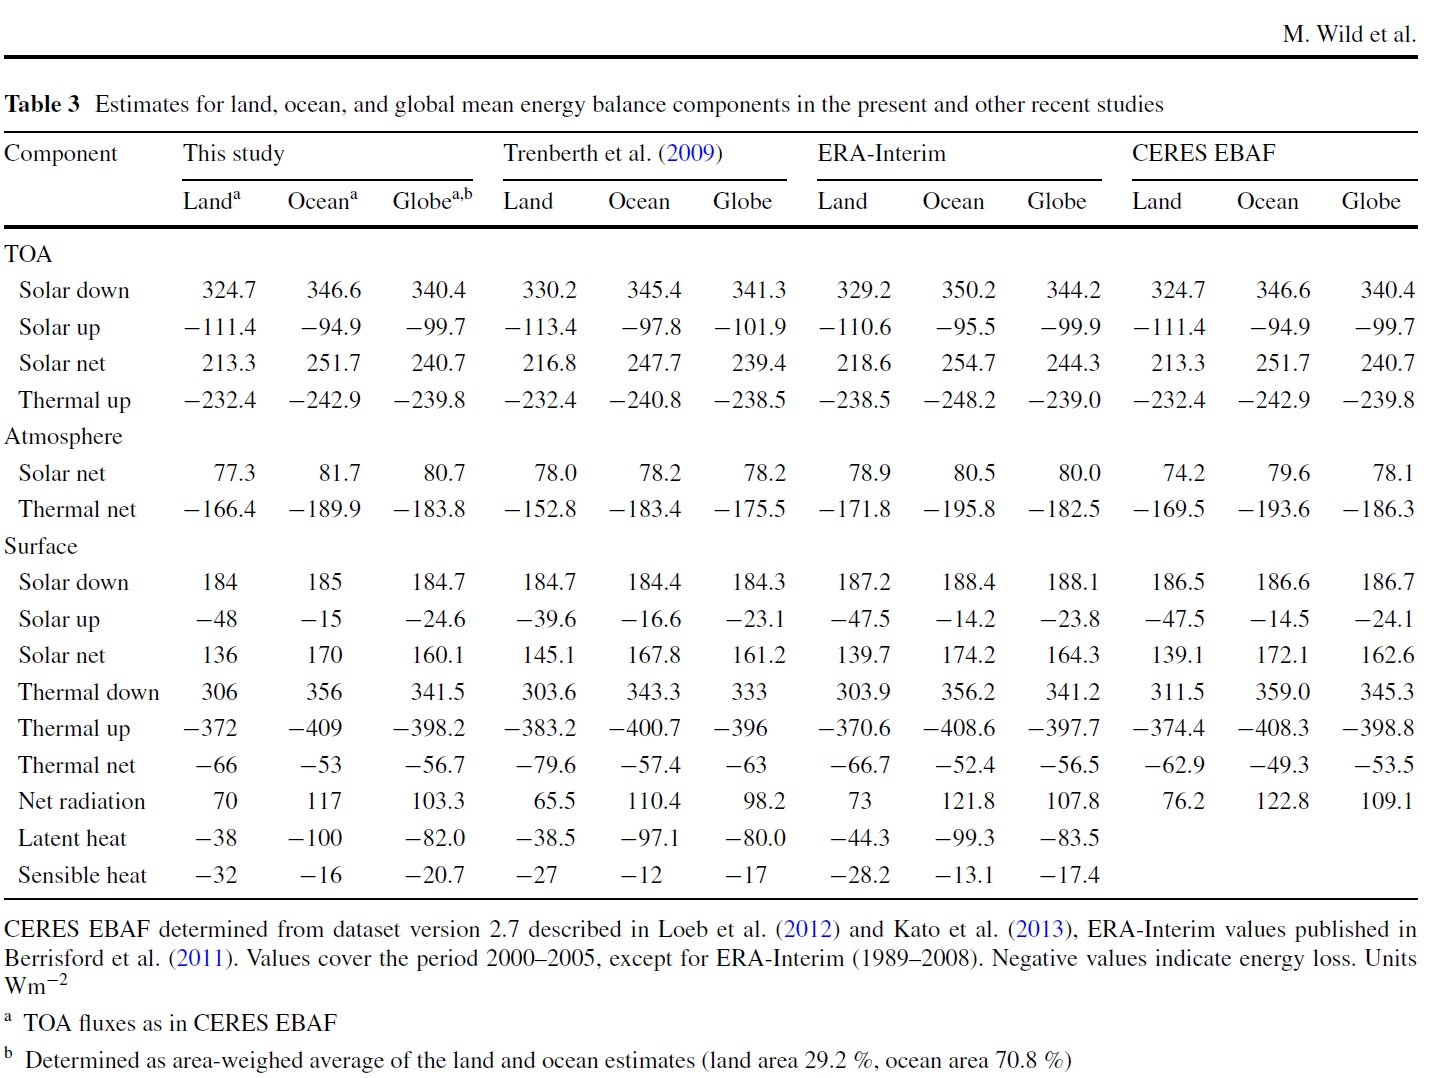
The corresponding flux elements can be found in tabulated forms such as shown below (Wild et al. 2015, Climate Dynamics):
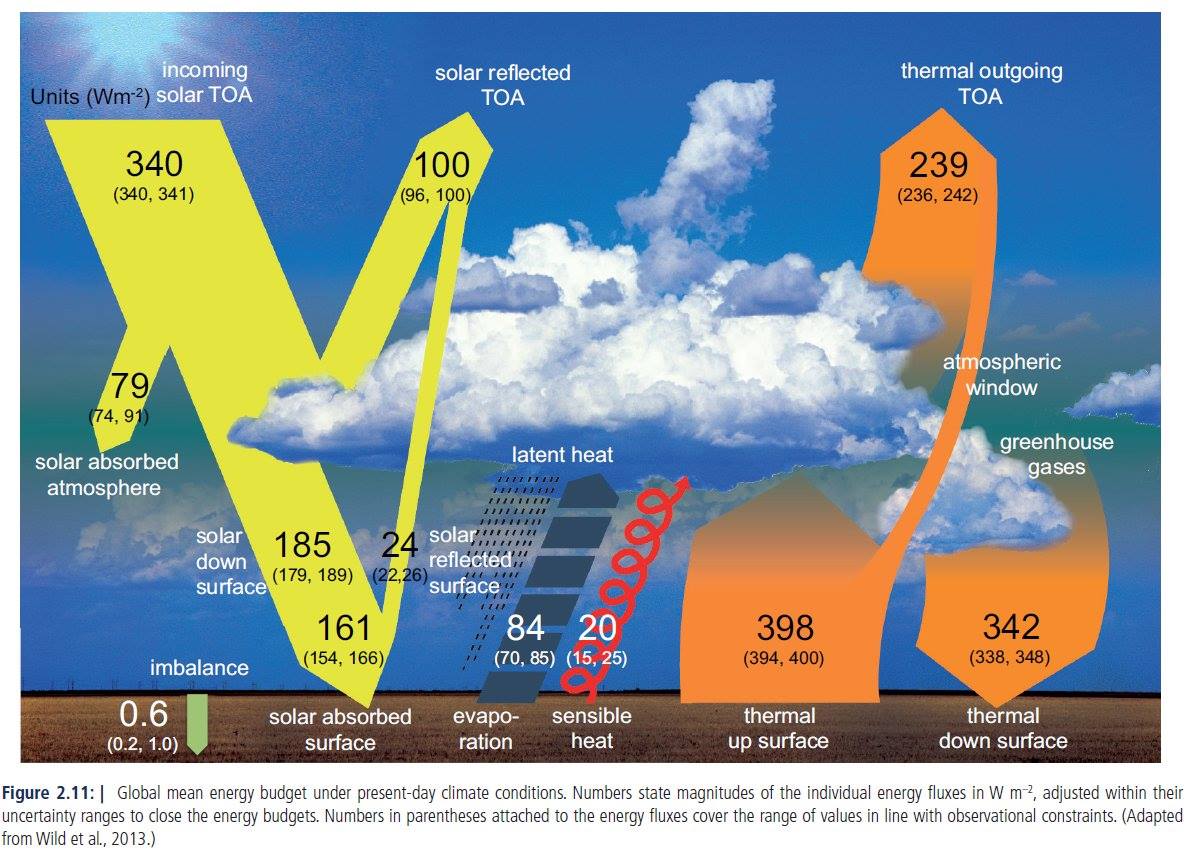
And can be found in nice and informative energy budget diagrams, such as this one, published in the UN IPCC Fifth Assessment Report of their Working Group I, created by Wild et al. (2013):
In the followings we will often refer to these tables and diagrams, and cite their data sources such as NASA CERES satellite measurements and other global energy and water cycle observations, assessments and climate models.
Continue reading at the Easy ('Prelude') or Medium ('Fugue') pages, or jump directly to the main site.
"To search for something – though it be mushrooms – or some pattern – is impossible, unless you look and try."
Dmitri Mendeleev
There are patterns in Earth's global energy budget.
Recent surface and satellite measurement systems are accurate enough to realize that there are patterns in Earth's annual mean energy budget. All the fundamental fluxes – surface upward and downward longwave radiations, outgoing longwave radiation, atmospheric and surface absorbed solar radiations, and the turbulent fluxes – are integer multiples of a certain unit flux, which itself is an element of the global energy flow system.
This is not a hypothesis, this is observation. In this website we do not ask the reader to imagine or accept this or that climate theory; we ask to look and try. Anyone who looks at the published energy budget data sets is able to reproduce this observation. The pattern is there, and we will show it in different, independent publications. The accuracy of the measurements discloses the possibility of a mere coincidence: the fit of the values is not only approximative but very sharp. Later we will show that the fit, actually, is exact. There are ratios of integers.
This is interesting in iteslf. Another, even more interesting observation is that the surface energy budget is strictly connected to the energy flows at the top of the atmosphere. If you know the magnitude of the energy flows at the upper boundary of the atmosphere, you are able to tell the values of the energy flows at the lower boundary. This is not a hypothesis either, but an observed fact of the published energy budgets. Our method – again, as throughout in this website – is to look and try.
The first question is not why the pattern is there. The first quation is: how accurate is the fit of the observed data to the pattern. Therefore first we will show that the accuracy is much better than the measurement error of the observations. In other words, the published mean values of the fluxes are always closer to the prescribed integer multiple value than the one-sigma uncertainty range of the given flux element.
Though in this website we are not going to speculate about the possible theoretical interpretation of the found structure, we still show a physical model which might be able to explain both of these peculiar features: the specific pattern and the constrained character of the Earth's basic energy flows.
What are we talking about? The basic concepts: Global Energy Budget, as given for example in this NASA Langley Research Center's education poster, and the energy flows (fluxes) in it, as presented in tabulated forms and diagrams as shown below.
The corresponding flux elements can be found in tabulated forms such as shown below (Wild et al. 2015, Climate Dynamics):
And can be found in nice and informative energy budget diagrams, such as this one, published in the UN IPCC Fifth Assessment Report of their Working Group I, created by Wild et al. (2013):
In the followings we will often refer to these tables and diagrams, and cite their data sources such as NASA CERES satellite measurements and other global energy and water cycle observations, assessments and climate models.
Continue reading at the Easy ('Prelude') or Medium ('Fugue') pages, or jump directly to the main site.