Historical introduction
Observing and
Modeling Earth's Energy Flows,
Ten Years After
'Surveys in Geophysics' published a special collection in 2012, under the title Observing and Modeling Earth’s Energy Flows. The concluding study with the same title by Bjorn Stevens (director of Max Planck Institute for Meteorology in Hamburg) and Stephen Schwartz (Brookhaven Nat Lab) presented an energy balance diagram, where, first in the literature, an estimate was given for the uncertainties of the global mean energy flow components, and where the higher value of downward longwave radiation (DLR) from the atmosphere to the surface (342 Wm-2) was accepted (proposed by Martin Wild in the same year, instead of the earlier value of 324 Wm-2 in the Kielh-Trenberth 1997 estimate).
We put on the value of another essential climate parameter, longwave cloud radiative effect, LWCRE, from the same study, taken from the contemporary CERES observations as 26.5 Wm-2. This energy flow component connects clear-sky and all-sky energy budgets both at the upper boundary (outgoing longwave radiation, OLR at top-of-atmosphere, TOA) and at the surface (DLR), since LWCRE is defined as OLR(clear) – OLR(all) at the TOA and DLR(all) – DLR(clear) at the surface. This way, LWCRE might work as a “pacer” or “pacemaker” of the all-sky and clear-sky energy flow systems.
Therefore, we tried how the other components in the energy flow systems are related to LWCRE. We took LWCRE = UNIT ONE, and used the notation of LWCRE = 1, shown in red, bold type face. The figure below shows what we found.
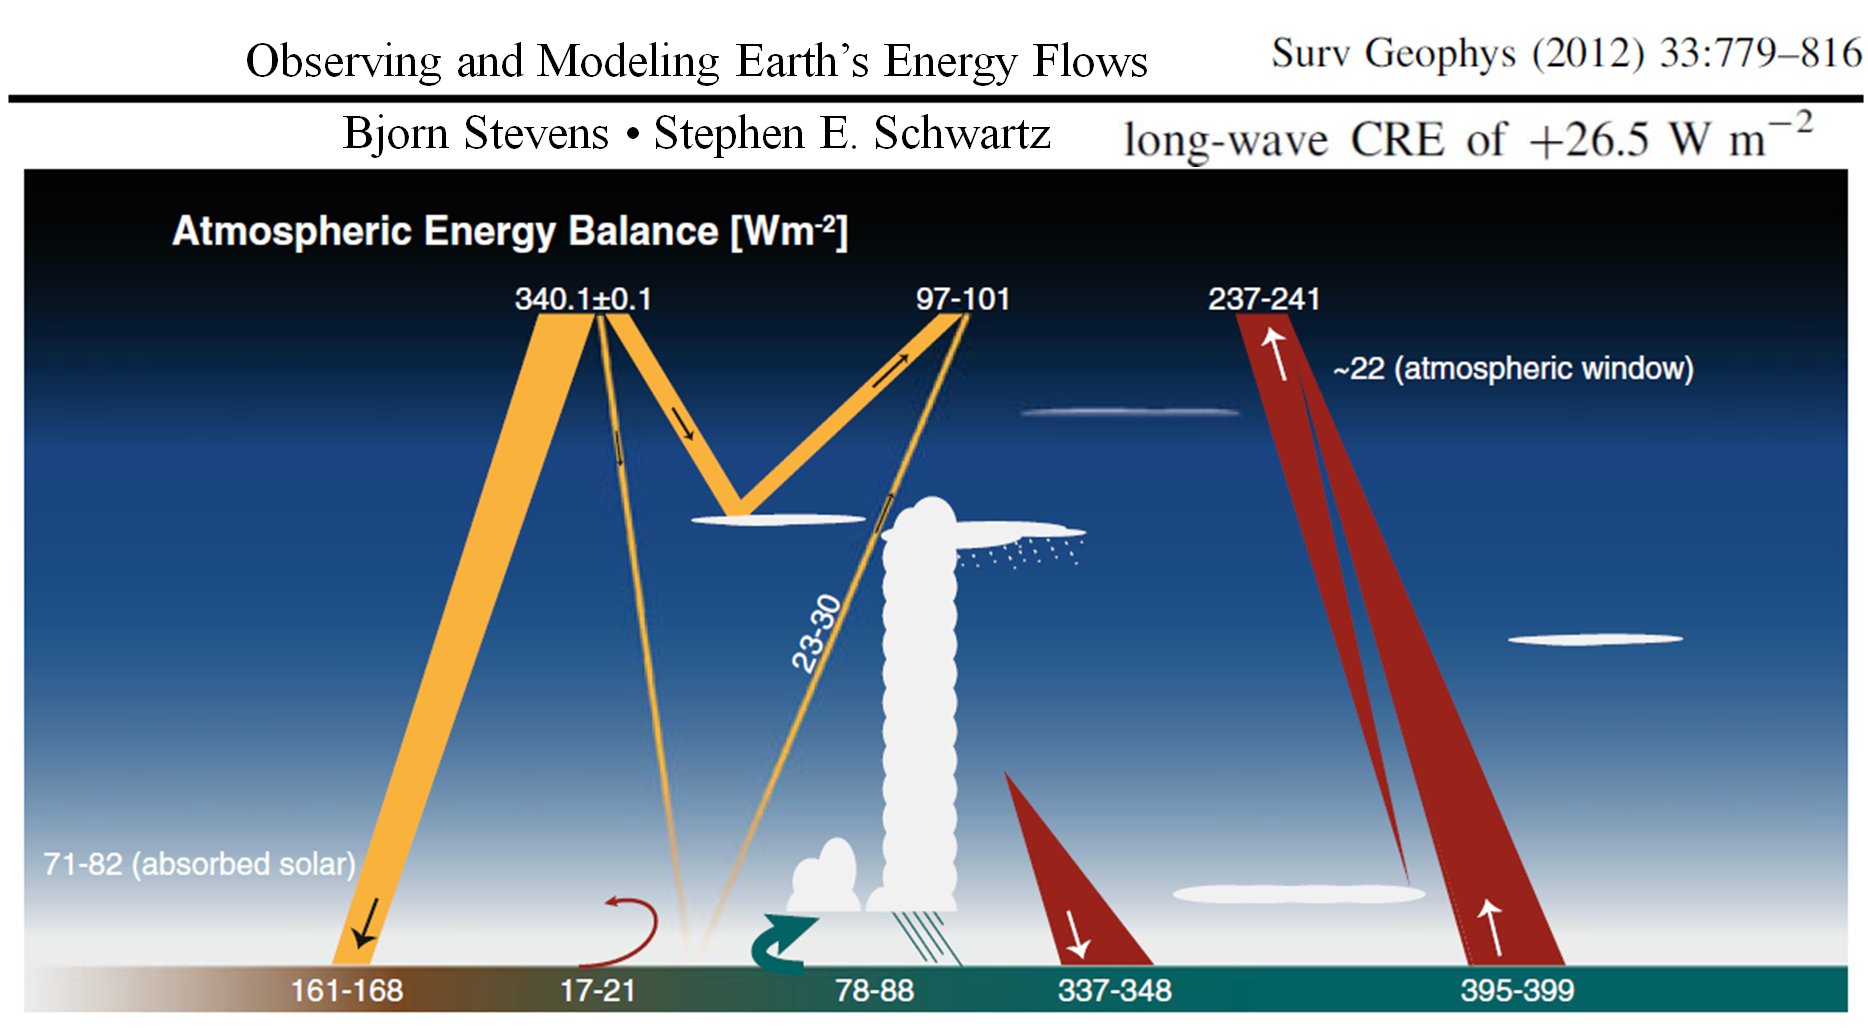
Most
of the noted energy flow components are within the stated
range of uncertainty; the only exception at the surface is solar
absorption
(159 Wm-2) which is a bit lower than the
suggested minimum value
(161 Wm-2).
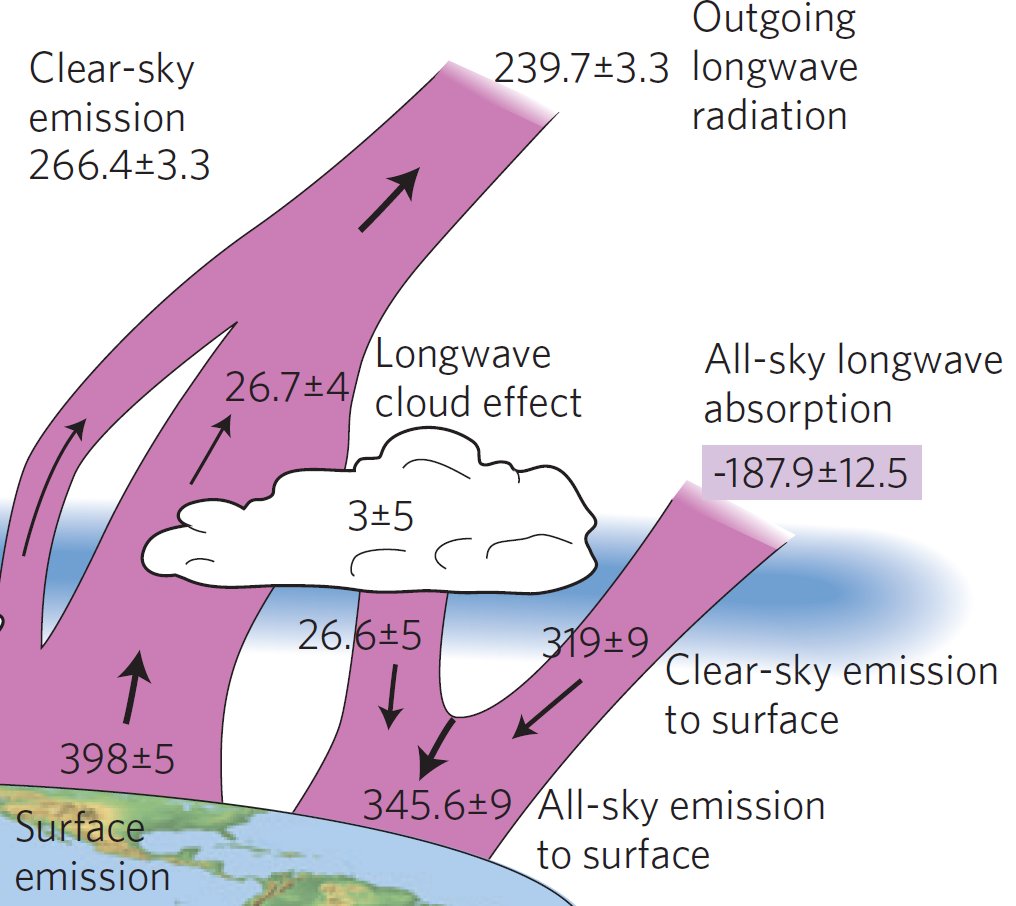
In the same year, Graeme Stephens and his colleagues (Norman Loeb, Seiji Kato, Paul Stackhouse, Tristan L'Ecuyer, Martin Wild and others) published an update on Earth's energy balance (Nature Geoscience, October 2012), where the longwave fluxes show the integer system far within the noted accuracy, if using the longwave cloud effect given in the study (26.7 Wm-2) as unit one:
One year later the IPCC has published its 5th Assessment Report, where Chapter 2 of the Working Group I (The physical science basis) presented the global mean energy budget under present-day climate conditions in Figure 2.11 (based on Wild et al. 2013). We projected the integer system on that diagram:
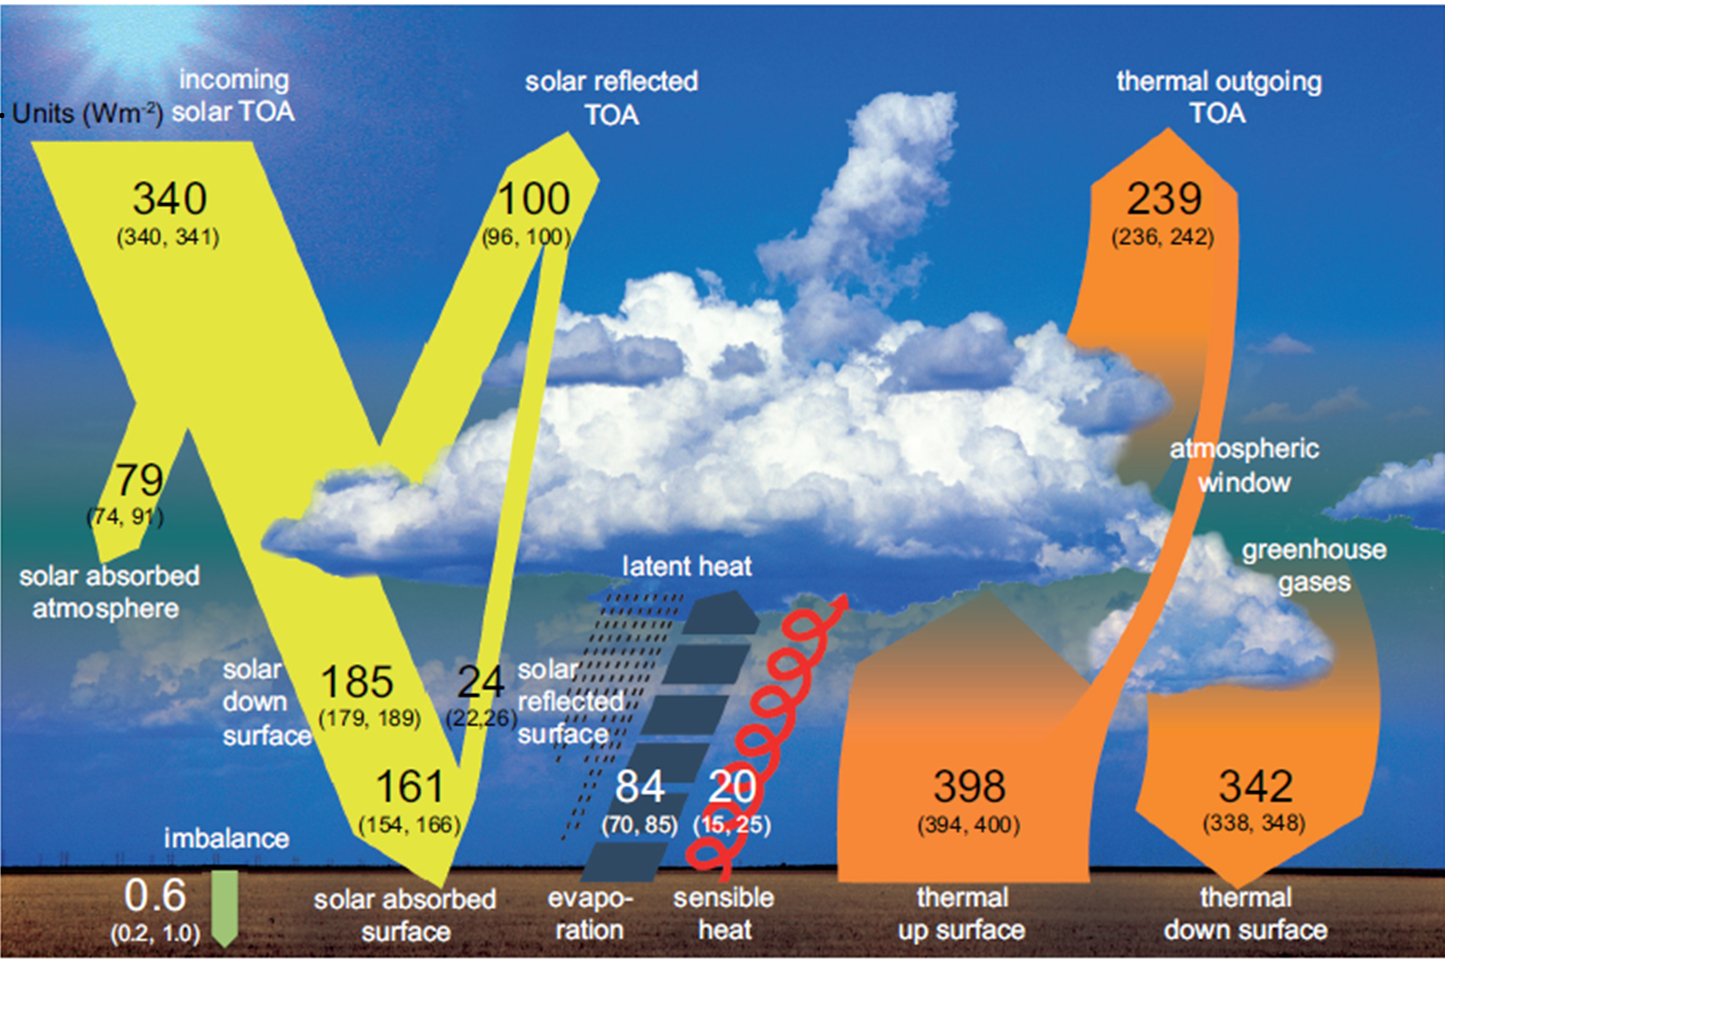
and
found that each component falls into the given range of
uncertainty (here we applied a slightly modified LWCRE = 26.67 Wm-2; the
upgraded energy flow diagram of Stephens et al. (2012) has 26.7 Wm-2).
The novelty here is that solar absorption at the surface (161 Wm-2)
is separated to its downward (185 Wm-2
and upward (24 Wm-2)
components, and each fit to an integer position separately.
More
importantly, the solar fluxes at TOA occupy integer
positions as well on the intercepting cross-section disk (that is,
before
division by 4 for spherical weighting), by an exact accuracy
(zero
difference).
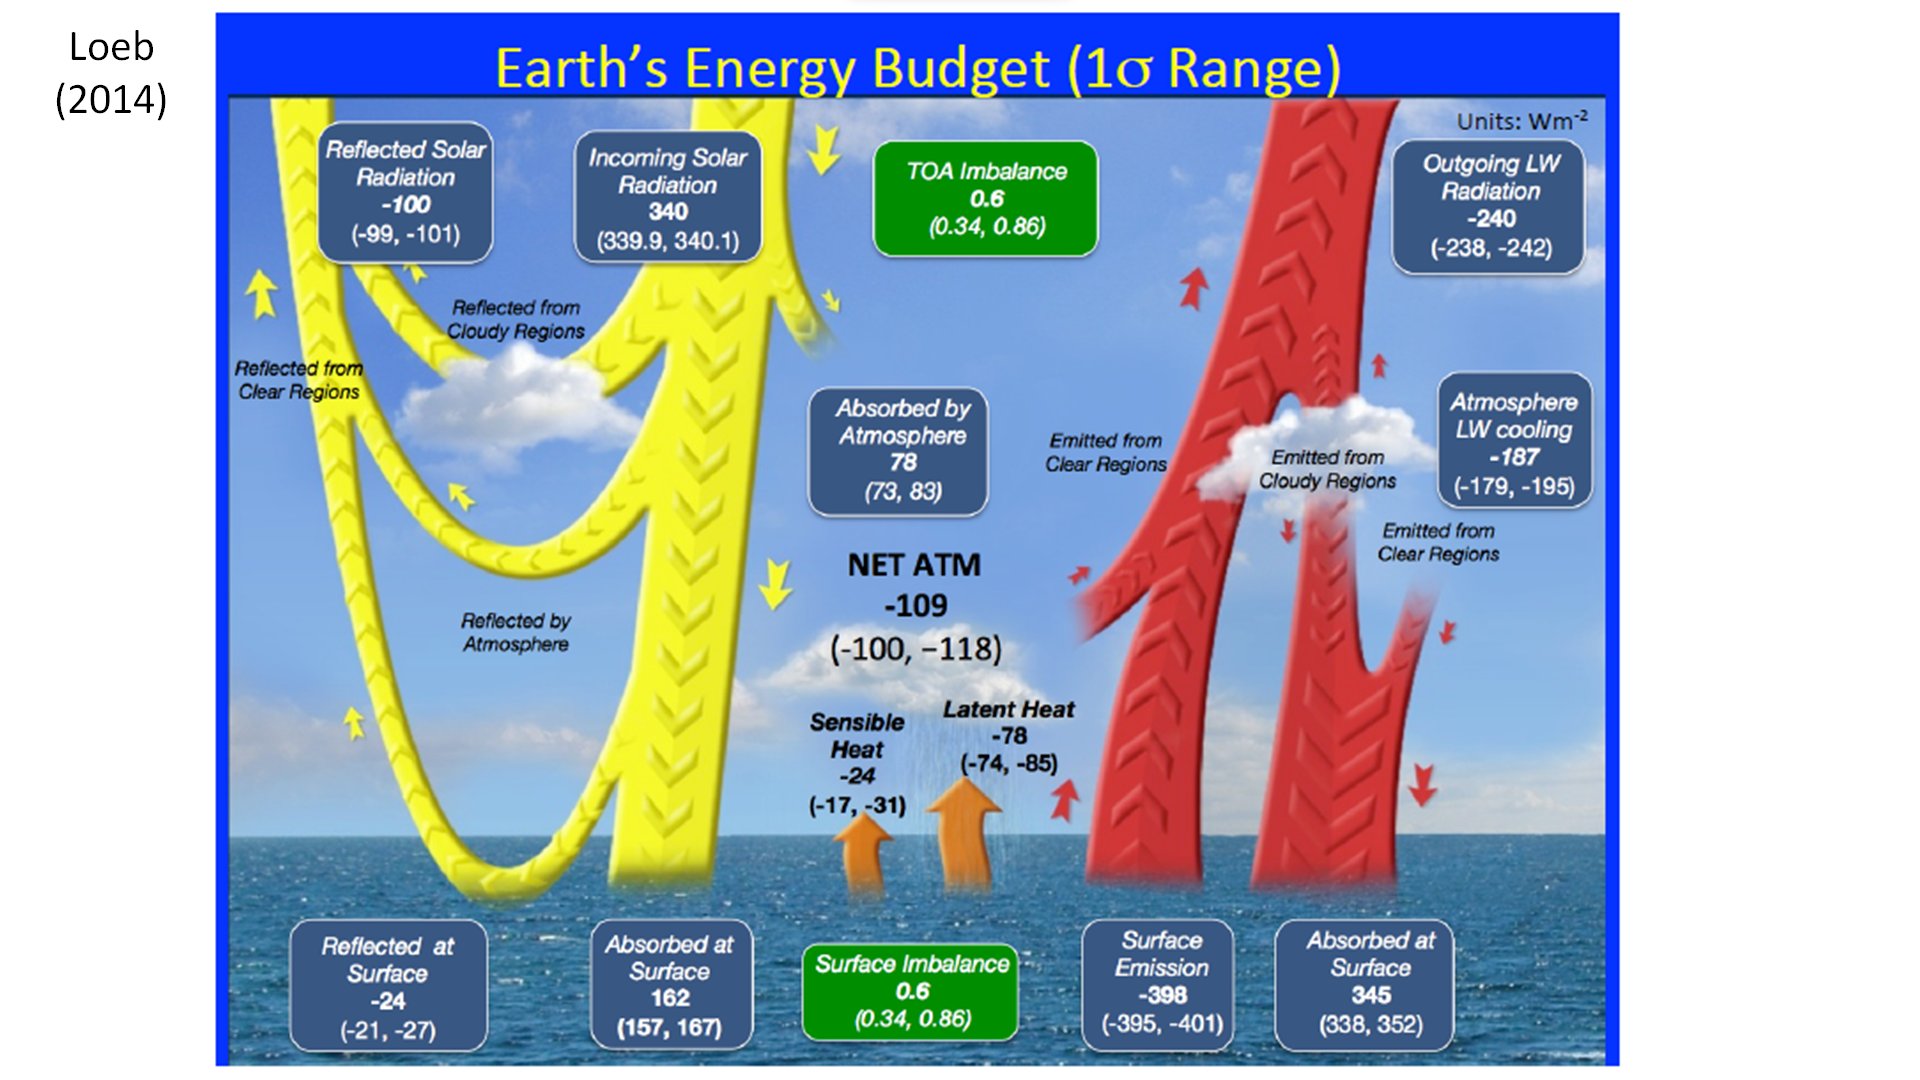
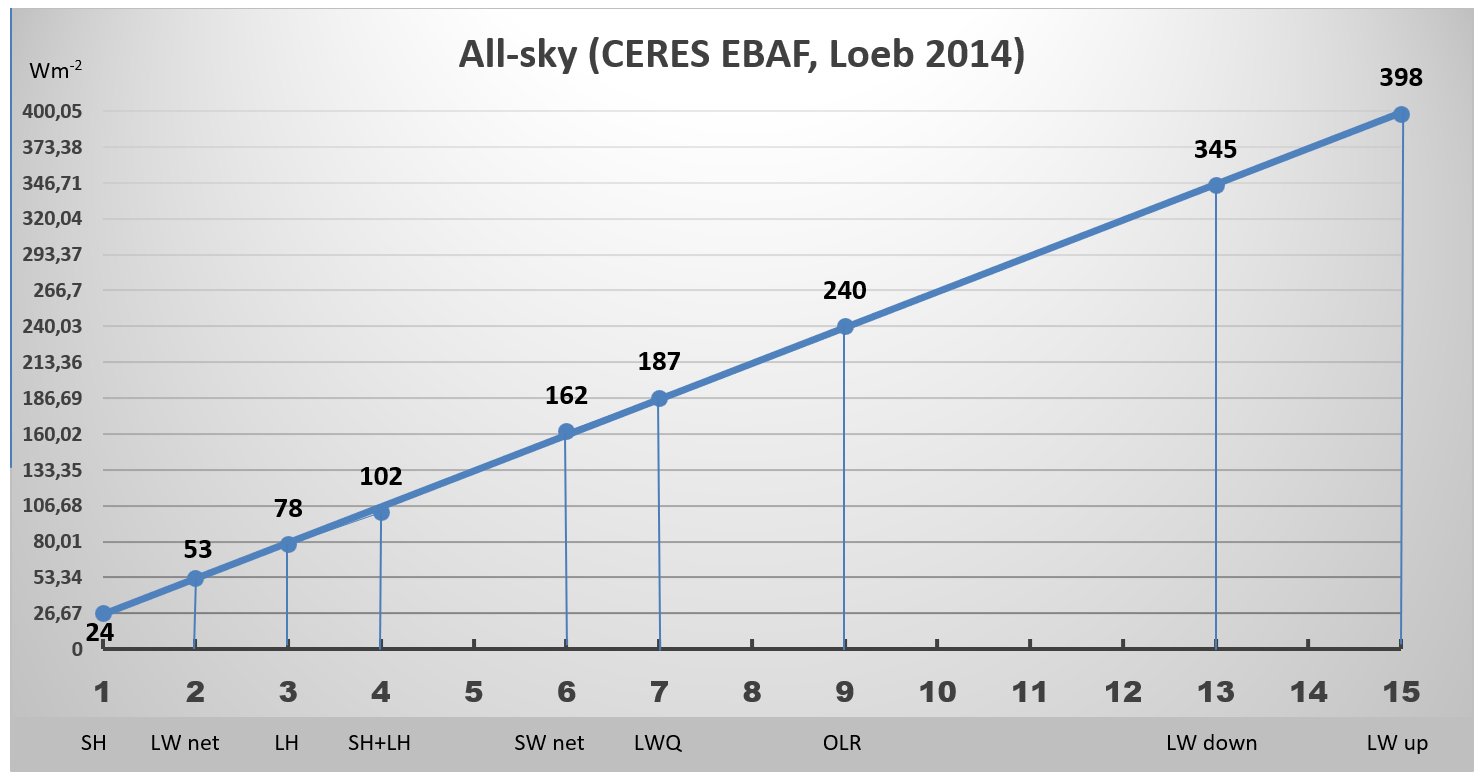
One year later again, in 2014, Norman Loeb published Earth's Energy Budget based solely on CERES observations of ten years. The TOA SW and LW fluxes are exact (zero difference), and again, each flux component is within the given error bar, by the largest difference is 2.67 Wm-2 only (notice that the CERES instrument calibration uncertainty is itself about 4.3 Wm-2). The essential climate parameter Atmospheric LW cooling is within 0.3 Wm-2.
Next
year L'Ecuyer et al. (2015), and in an immediate update
Stephens and L'Ecuyer (2015) presented the results of the NEWS (NASA
Energy and
Water-cycle Study), where the focus was on the most accurate possible
determination of the components of the non-radiative flux components at
the surface: sensible
heat and evaporation (latent heat). We
take LWCRE from a then-contemporary study of the same authors (Stephens
et al.
2012) as 26.7 Wm-2. The fit of the integer
system on these estimates
is given below:
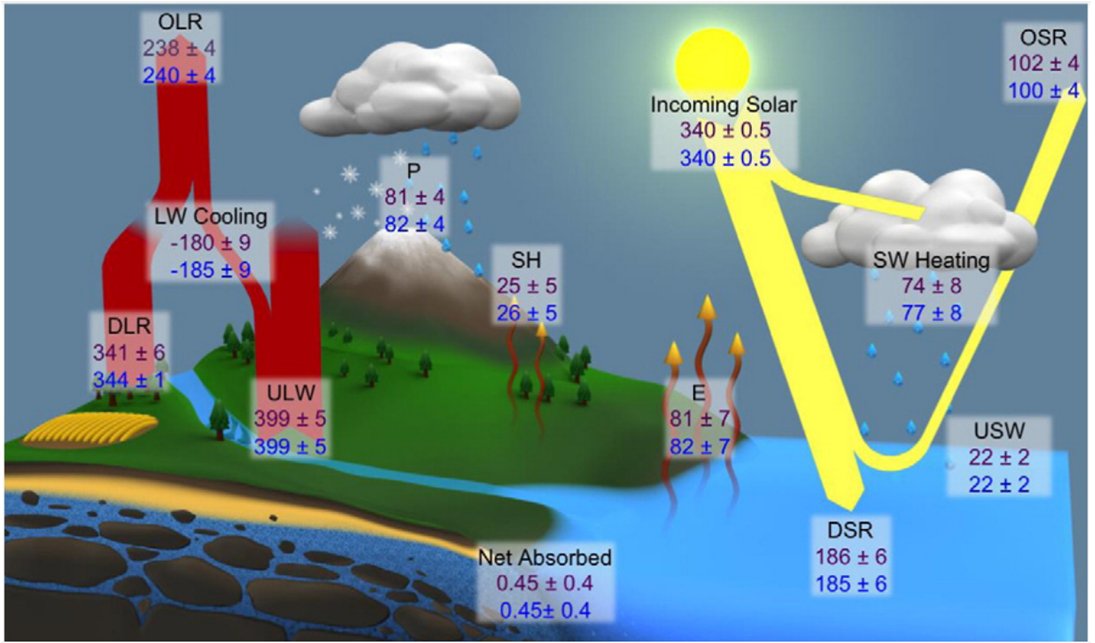
As these estimates depict a consistent overall "atomic" structure in the all-sky, we were looking for direct data from the CERES datasets for both all-sky and clear-sky energy flow components.
Continue on "CERES data" page or go back to the "main page".