Geometric deduction
This chapter provides a geometric deduction of the integer energy flow system, starting from the simplest single-layer greenhouse model. The final result, both for clear-sky and all-sky, is compared to CERES data.
Construct a numbe of idealized models,
work out the theoretical solution for each separately,
and then examine the extent to which the earth's atmosphere
partakes to their several chracteristics.
(E.A.Milne: Radiative Equilibrium: the Insolation of an Atmosphere. 1922)
Here we show a deduction of the integer system. The
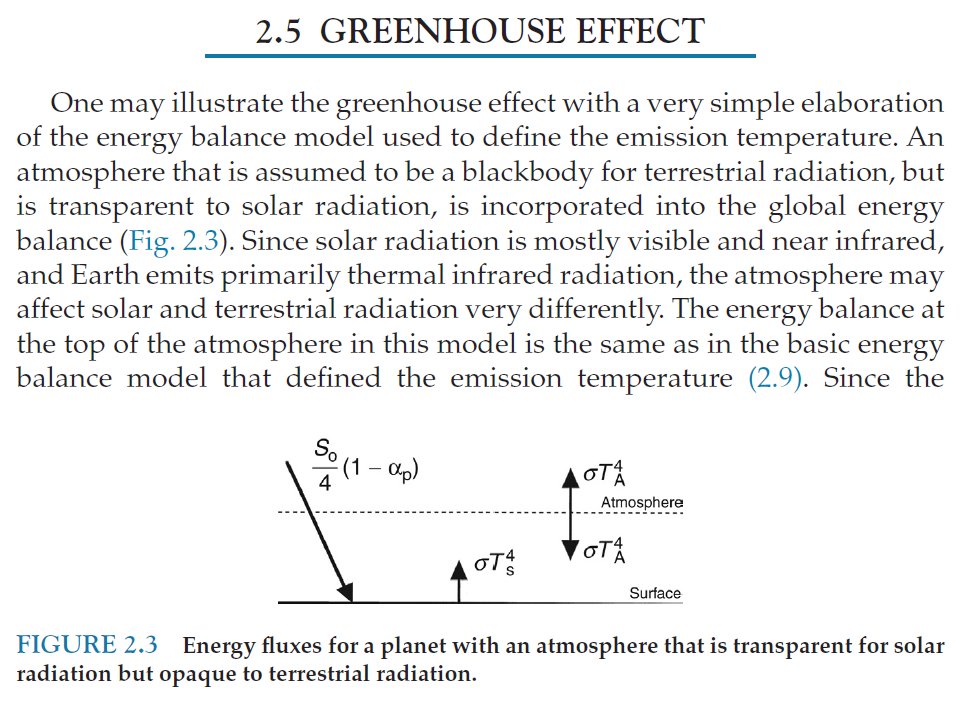
starting point is the simplest greenhouse model, consists of a surface
and an opaque atmospheric layer. No greenhouse gas concentration, no
aerosols, no lapse rate is assumed. We will show that the resulted
energy flow structure accurately describes Earth's actual clear-sky
and all-sky system.
Hartmann: Global Physical Climatology (1994, 2016)
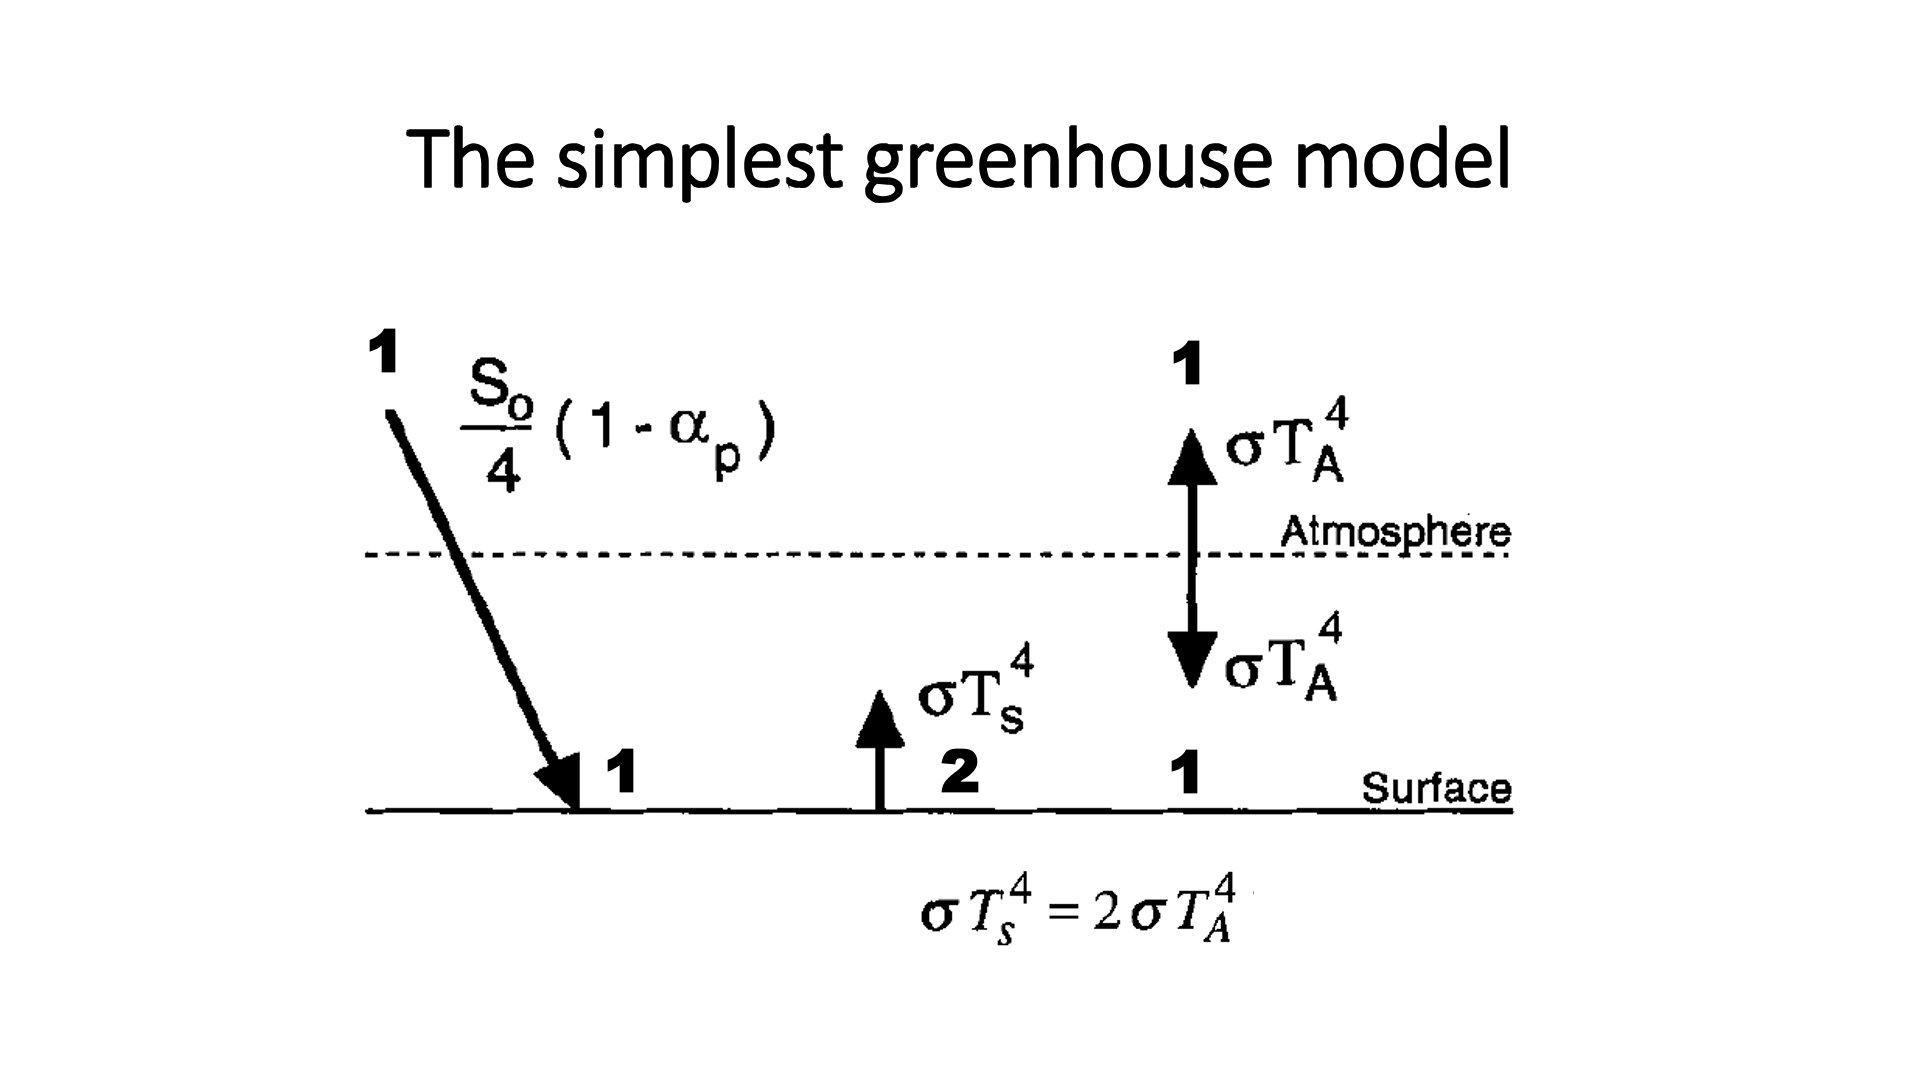
The "one-two-one" ratio system:
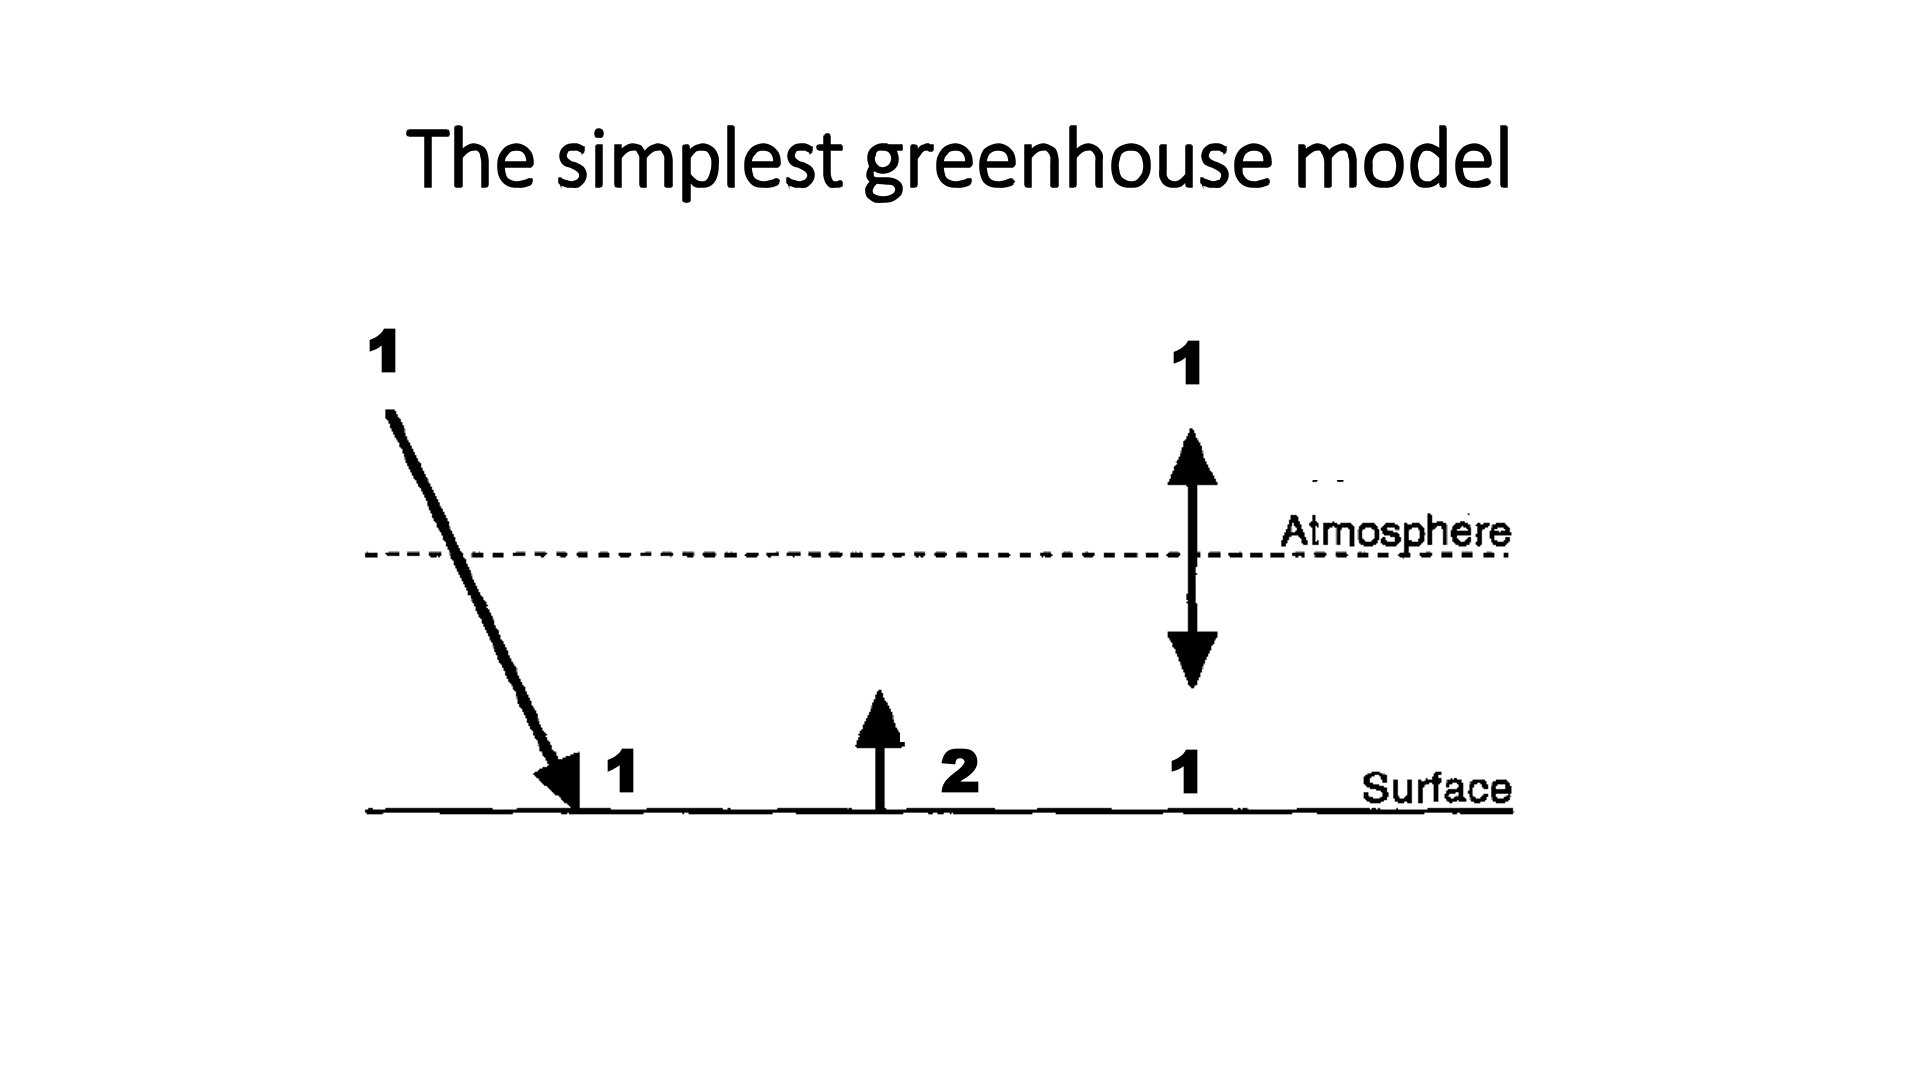
The starting point:
Multiply by five:
Introduce ONE UNIT solar reflection (RSR) at TOA:
This was an essential step.
(If the Schwarzschild equations are correct and we have an integer ratio system, the greenhous theory should be modified by taking into account these constarints, but the molecular science as we know it works. But if this step is correct, that is, if solar reflection at the TOA is a defintite integer number, unit of ONE while TSI is FIVE, without any reference to surface reflective properties, atmospheric reflective particles, anything, only we have an arithmetic quantal unit, then we encounter something new that points beyond the science as we know it today, towards something deeply principled geometry. Only observation can tell whether this is true.)
Absorbed Solar Radiation in the system then will be 4 units.
Now allow ONE UNIT solar absorption in the atmosphere: (SAA)
Solar Absorption Surface decreases to 3, Downward Longwave Radiation increases to 5 units.
Now add TWO UNITS turbulence at the surface, this way Eqs. (1) and (2) are satisfied:
Now we have to calibrate the system to observations- We do it in the following way:.
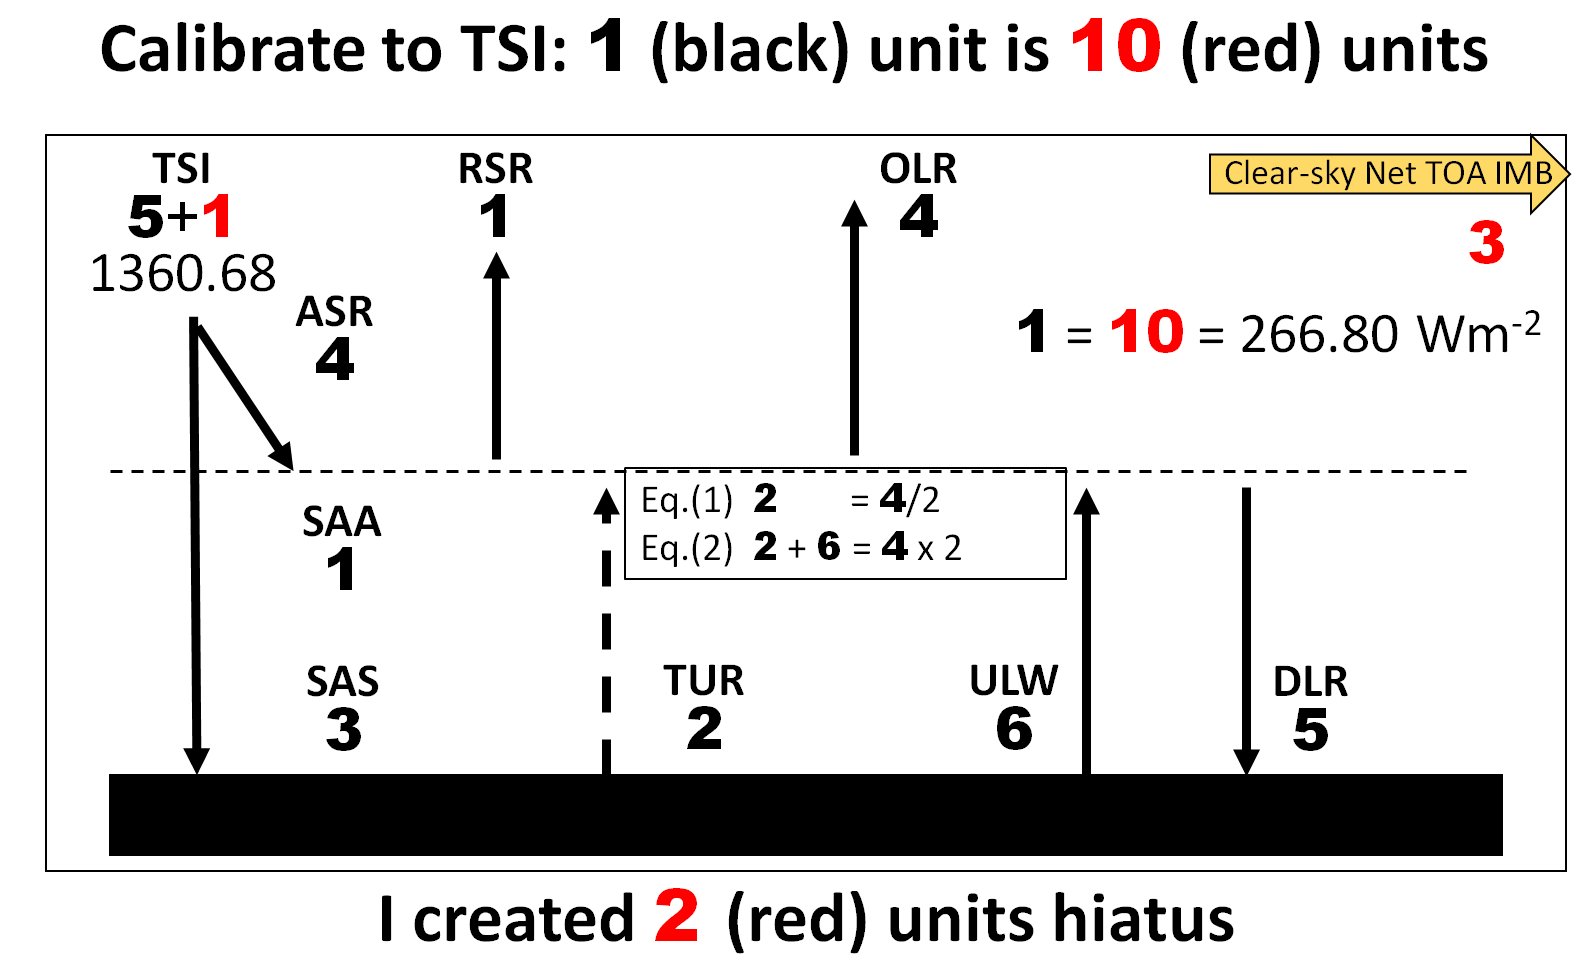
We will use ONE RED UNIT as LWCRE = 1 = 26.68 ± 0.01 Wm-2 , while one BLACK unit being equal to 10 RED units.
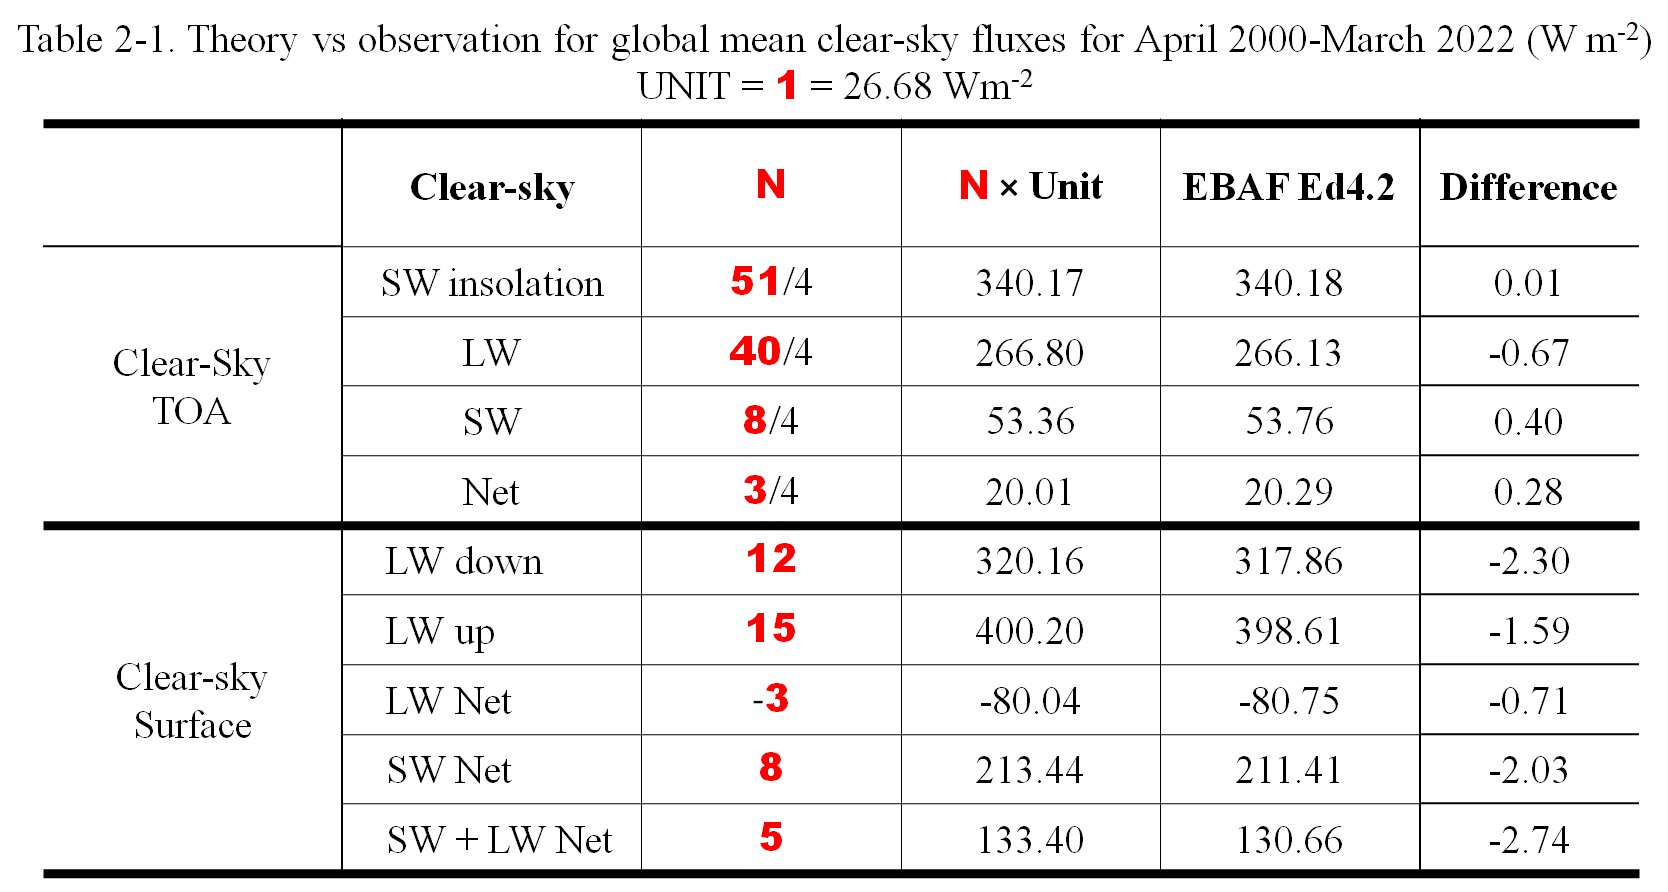
We know that in the clear-sky, there is a net imbalance at TOA, see our Table 2-1 previously, what we set to 3 units.
This waay, Total Solar Irradiance will be 5 BLACK UNITS + 1 RED UNIT, or 51 RED UNITS.
If spherical weighting (factor 4) is used, this gives TSI = 1360.68 ± 0.5 Wm-2.
But CERES is quite explicit in using geometric weighting, with a factor of 4.0034, leading to
TSI = 51 × 26.68 × (4.0034/4) = 1361.84 Wm-2.
This TSI is our expectation for the external energy source to maintain Earth's energy flow system.
By this way of calibration (adding ONE to TSI, sending THREE to clouds) we have created TWO RED UNITS hiatus.
Solution::Reflect TWO RED UNITS less:
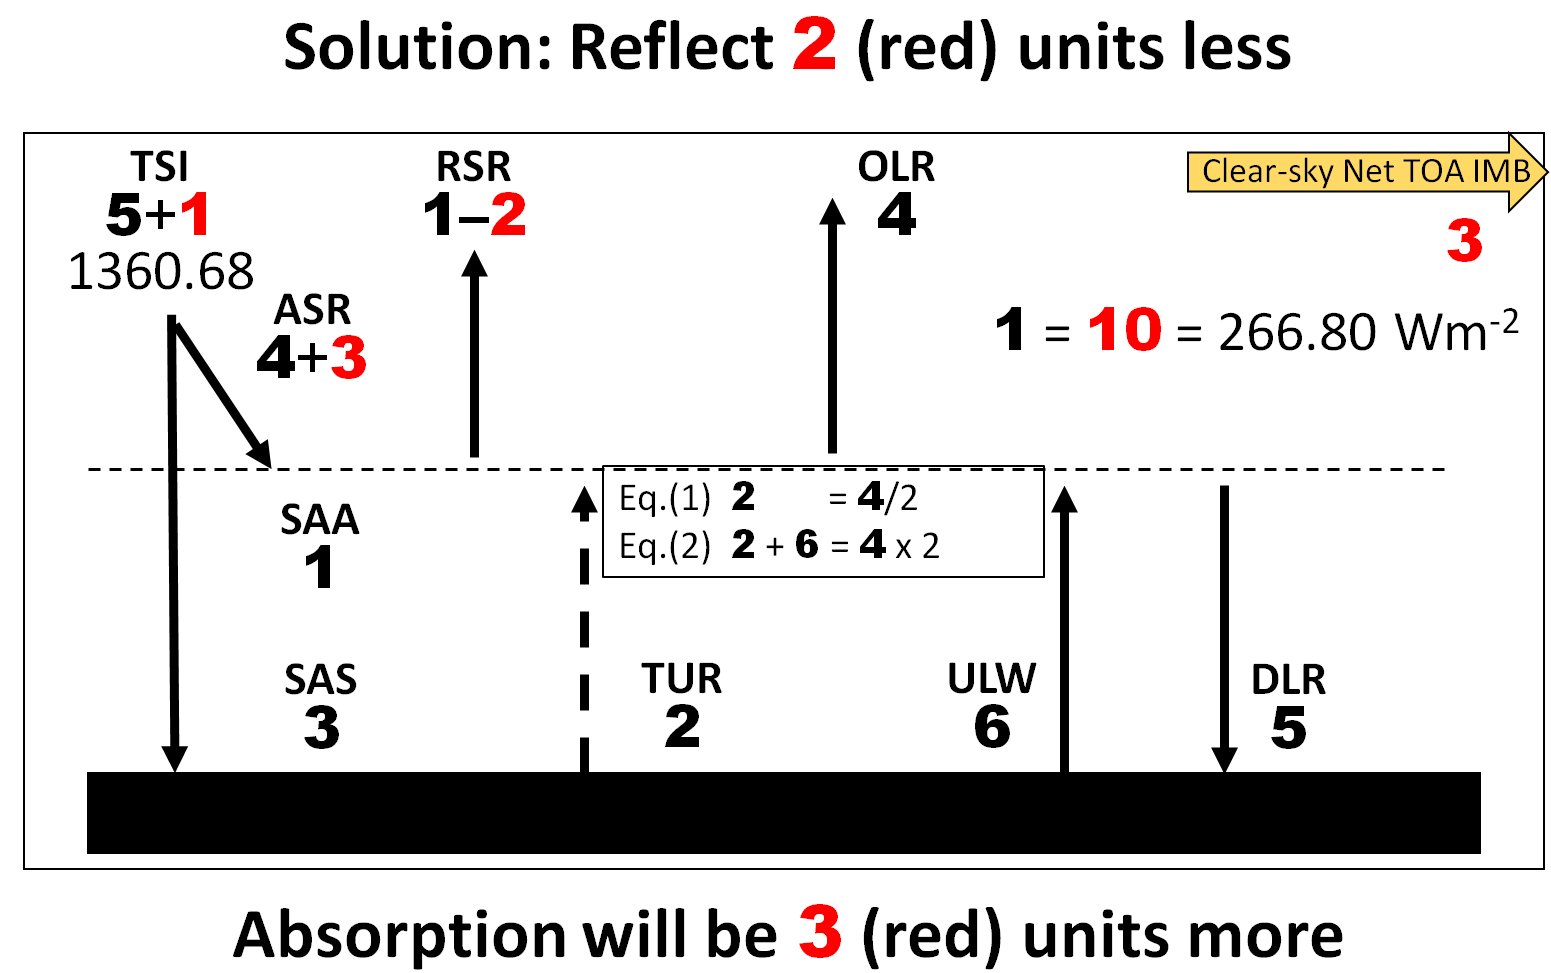
This way, we found THREE RED UNITS more in the absorption.
Re-distribute this by allowing ONE to be absorbed in the atmosphere and TWO at the surface:
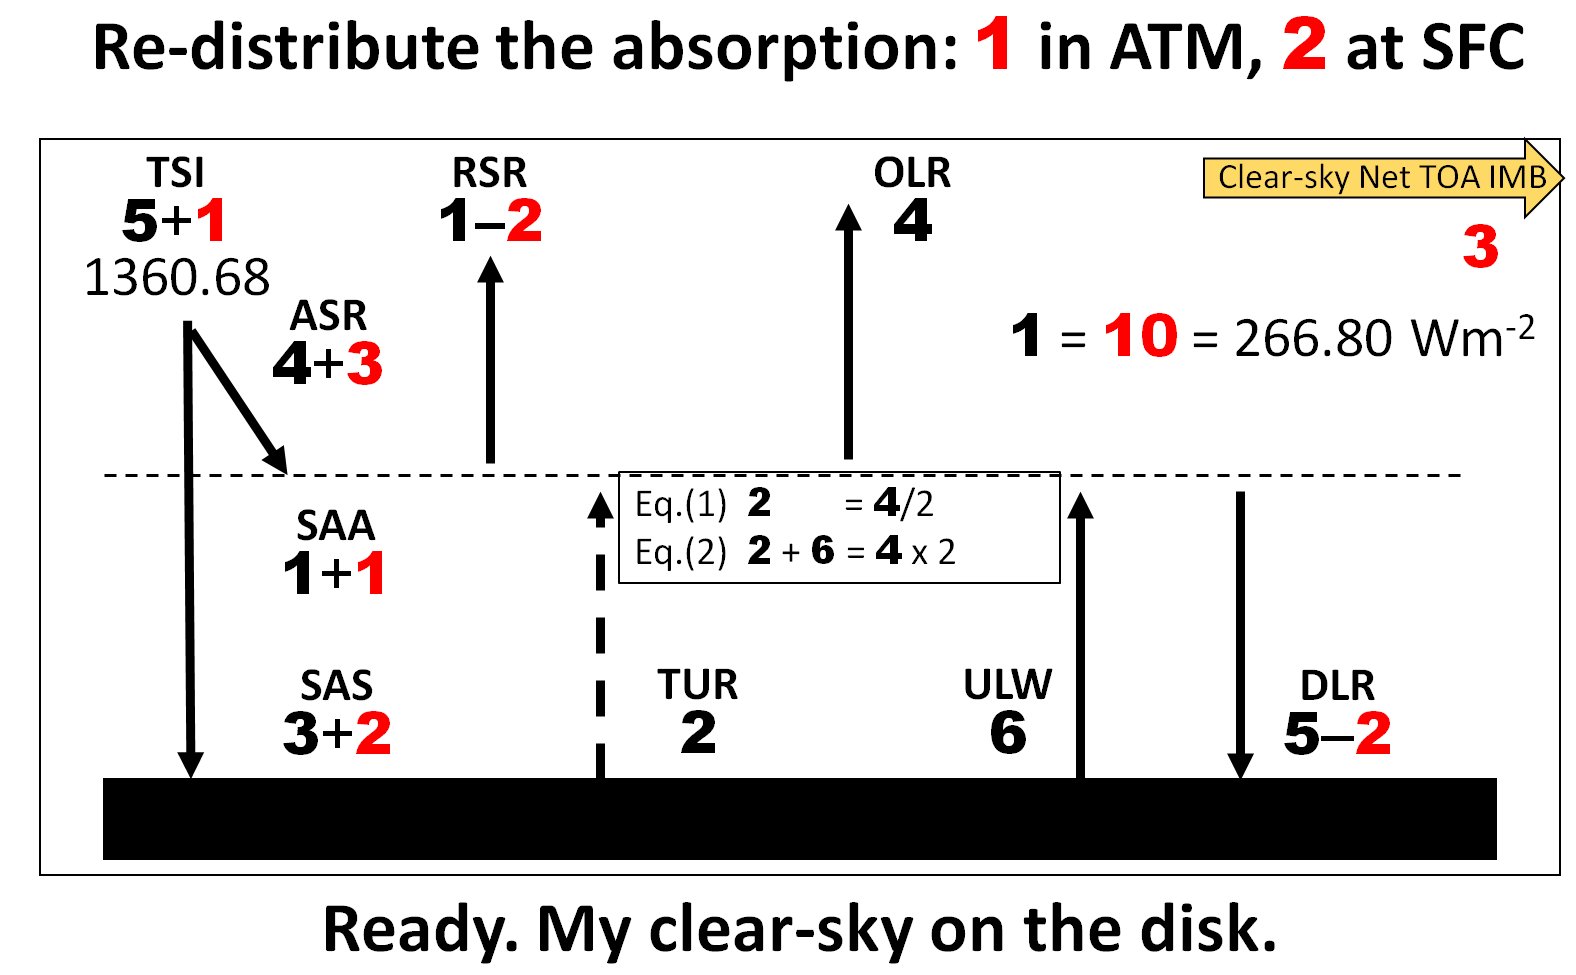
We are ready, No more change is needed in the energy flow system. What follows is simply writing everything into RED units:
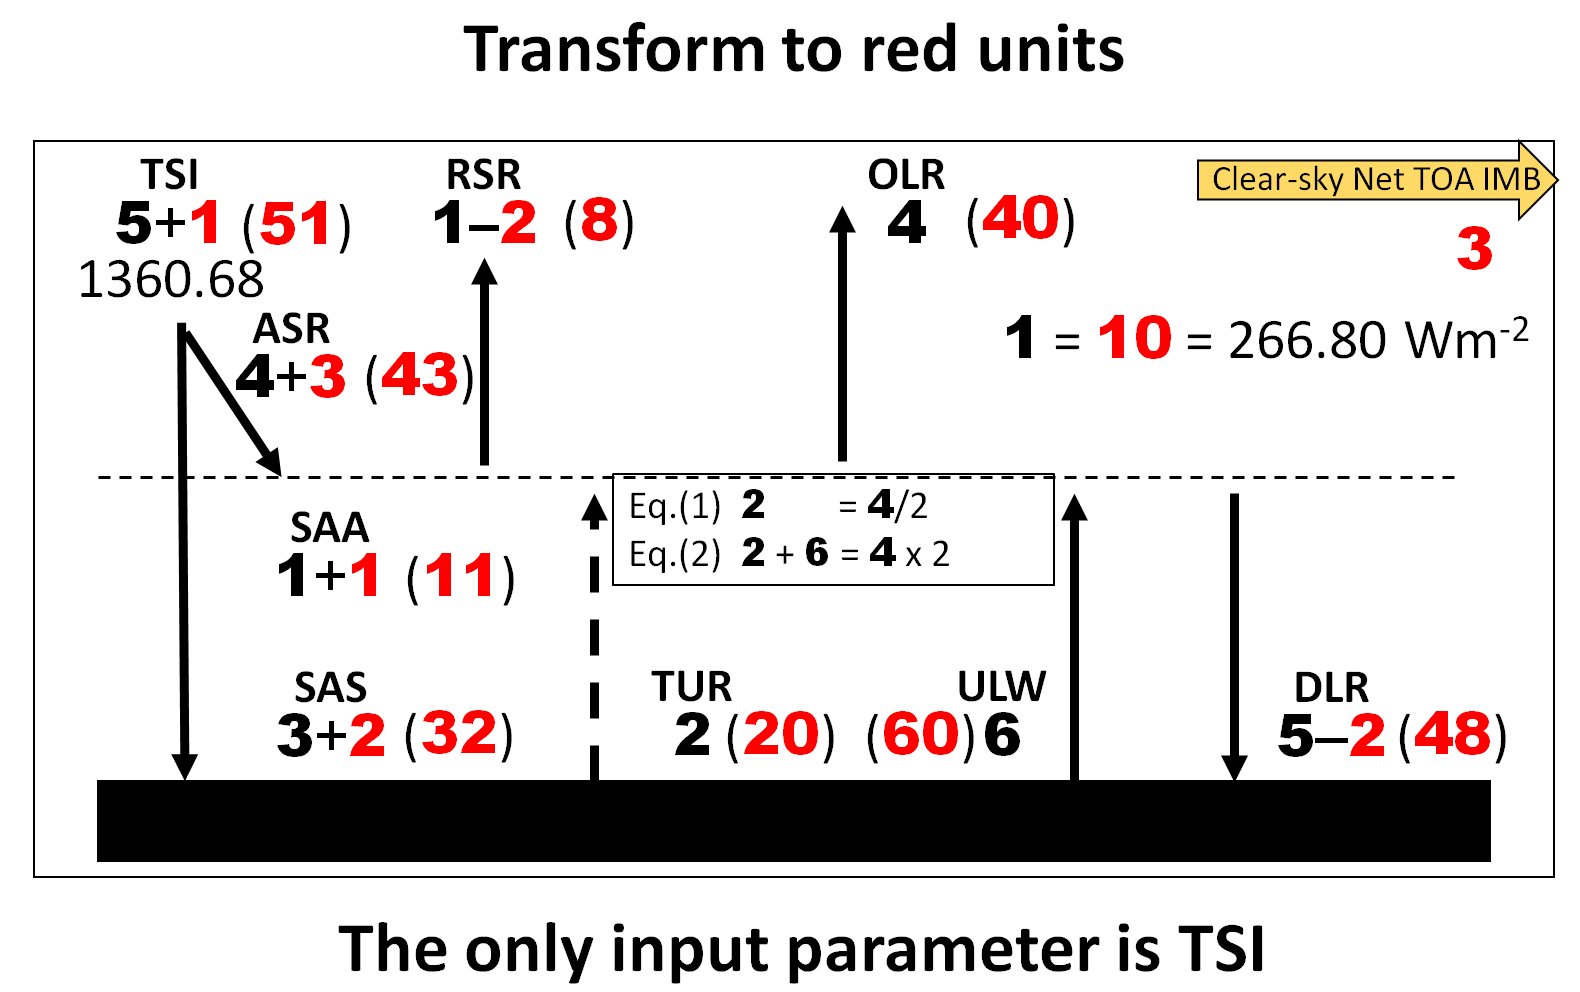
Divide by four for spherical weighting:
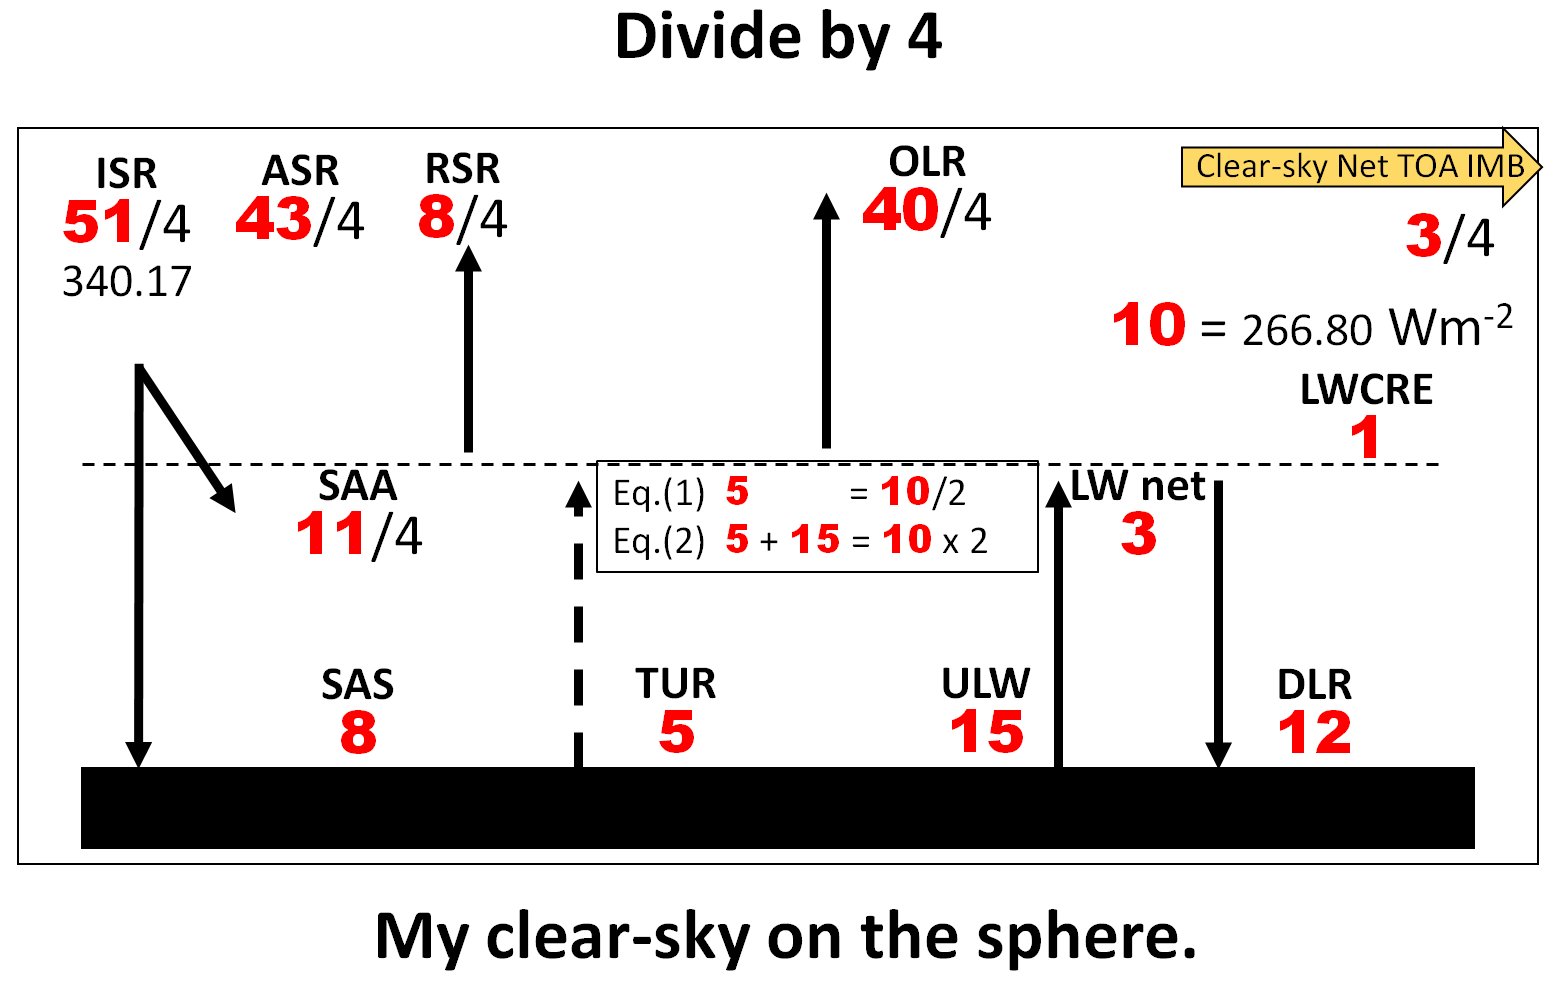
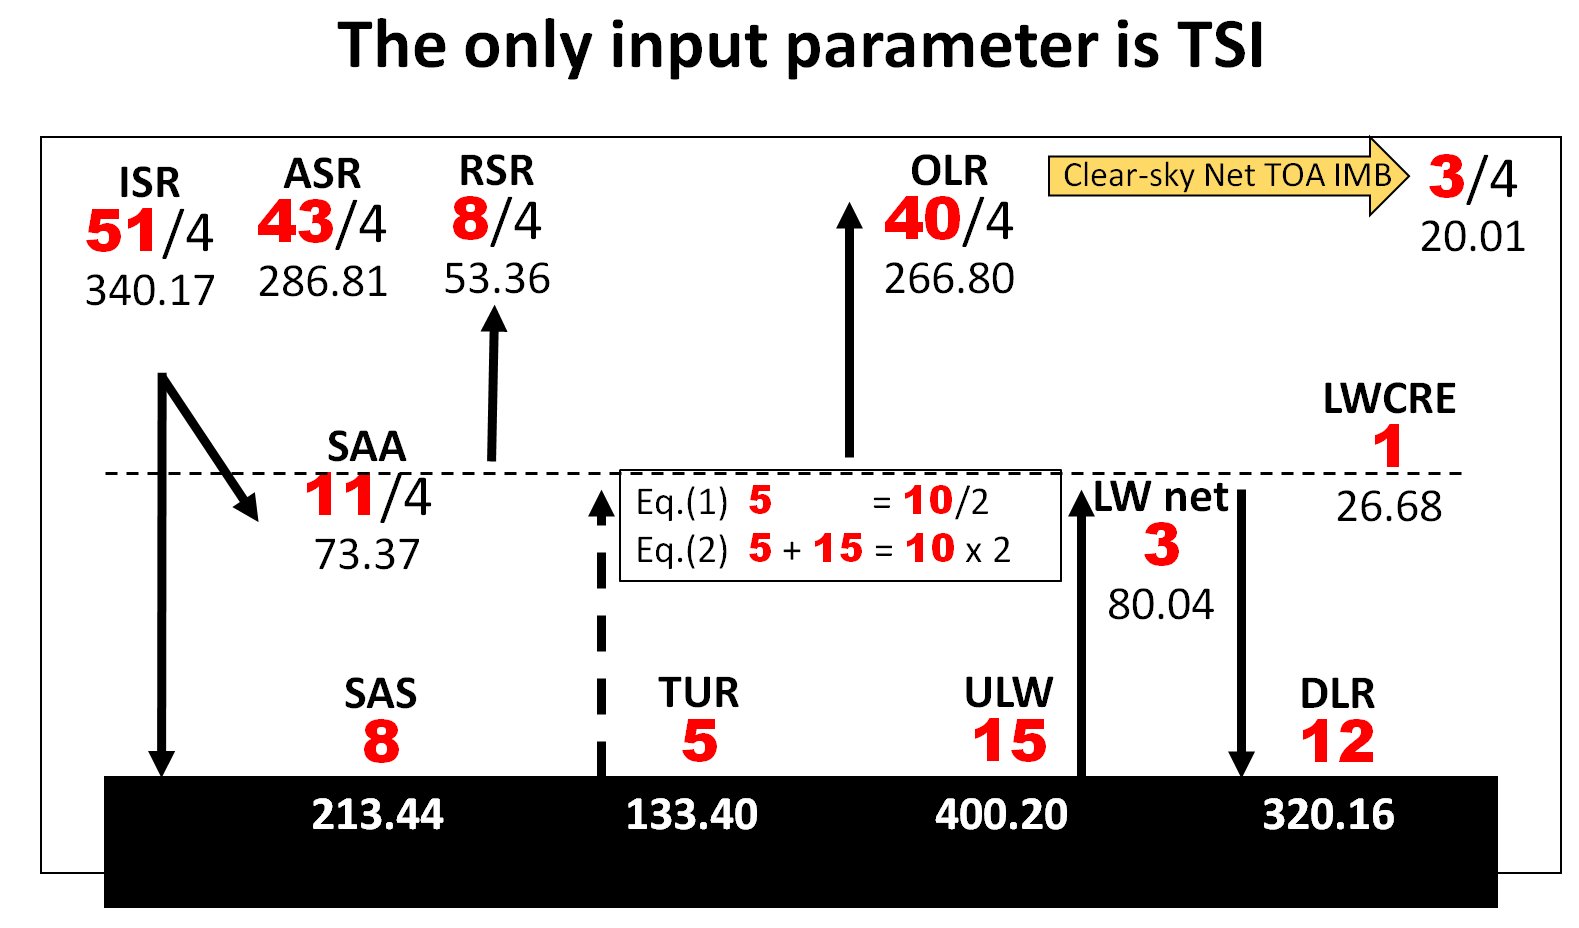
Write tn the values in Wm-2.
We may use either the best fit from CERES as UNIT ONE = 26.68 Wm-2,
or Incoming Solar as ISR = 340.17 Wm-2.
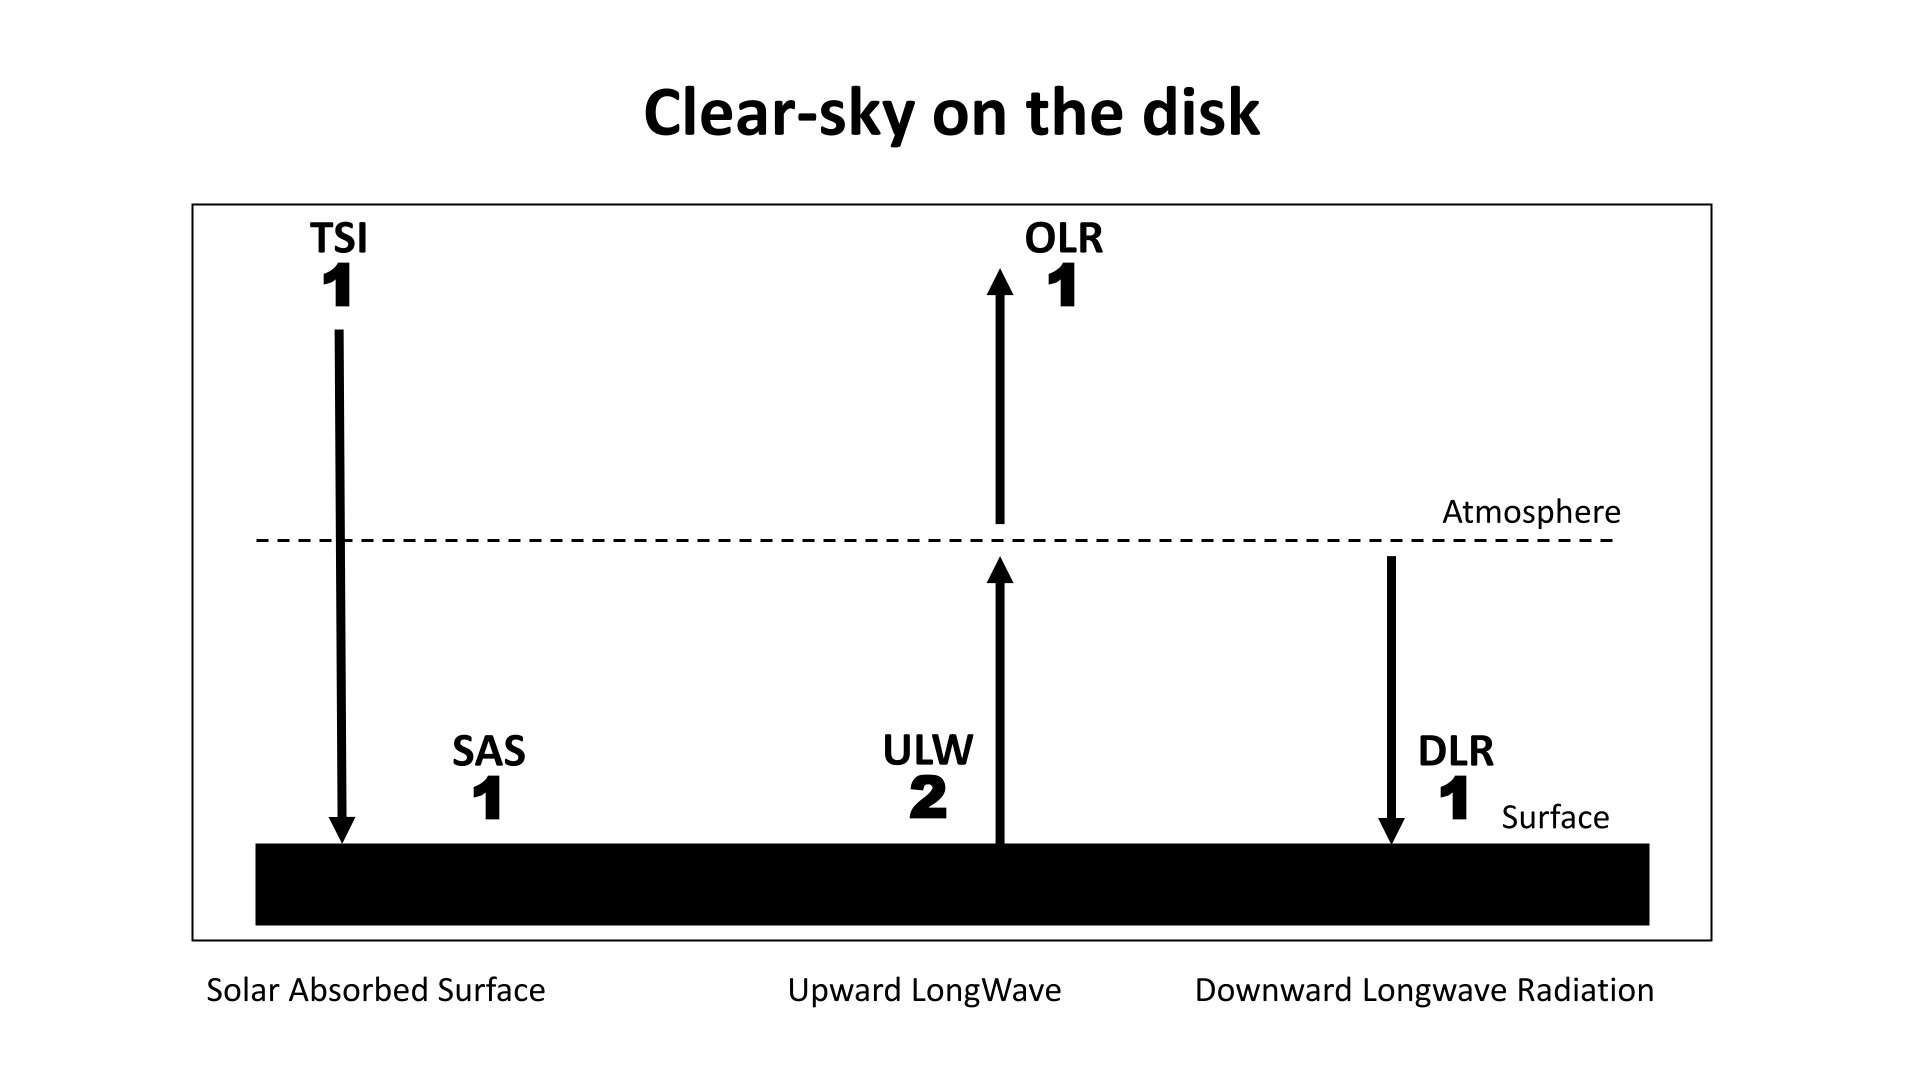
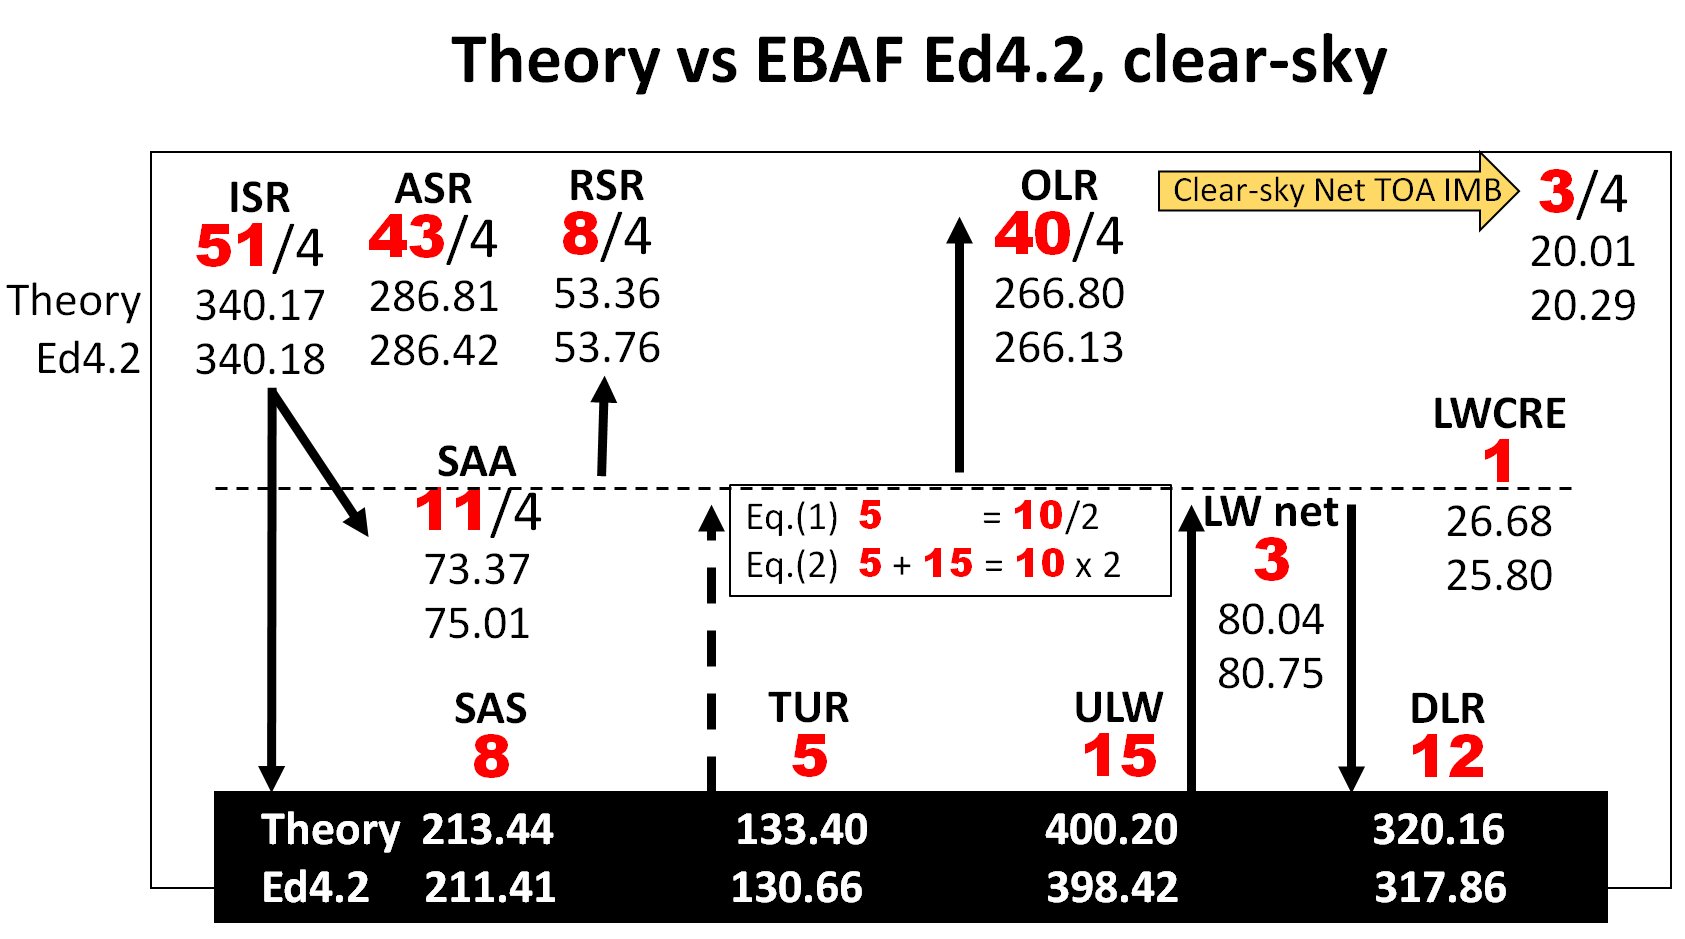
And we have arrived to our final clear-sky arrangement, theory versus observation:
Then by transformin the clear-sky OLR of TEN RED UNITS down to NINE, utilizing that ONE UNIT = LWCRE:.
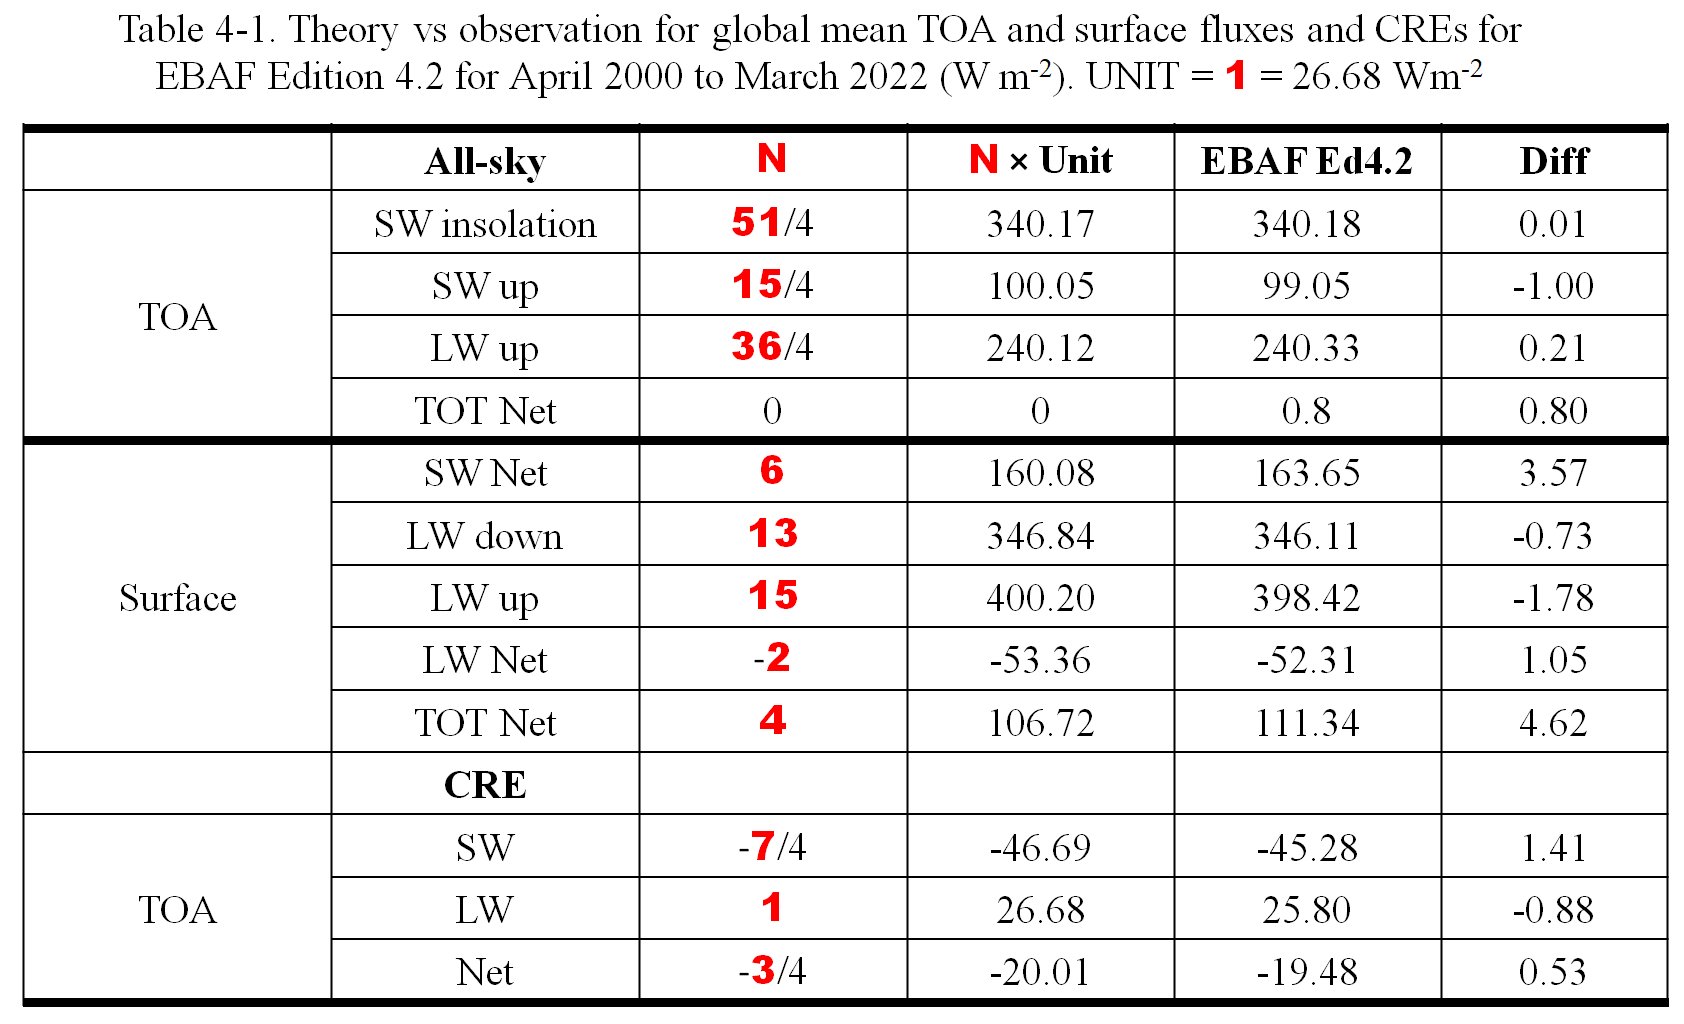
we get the all-sky system:
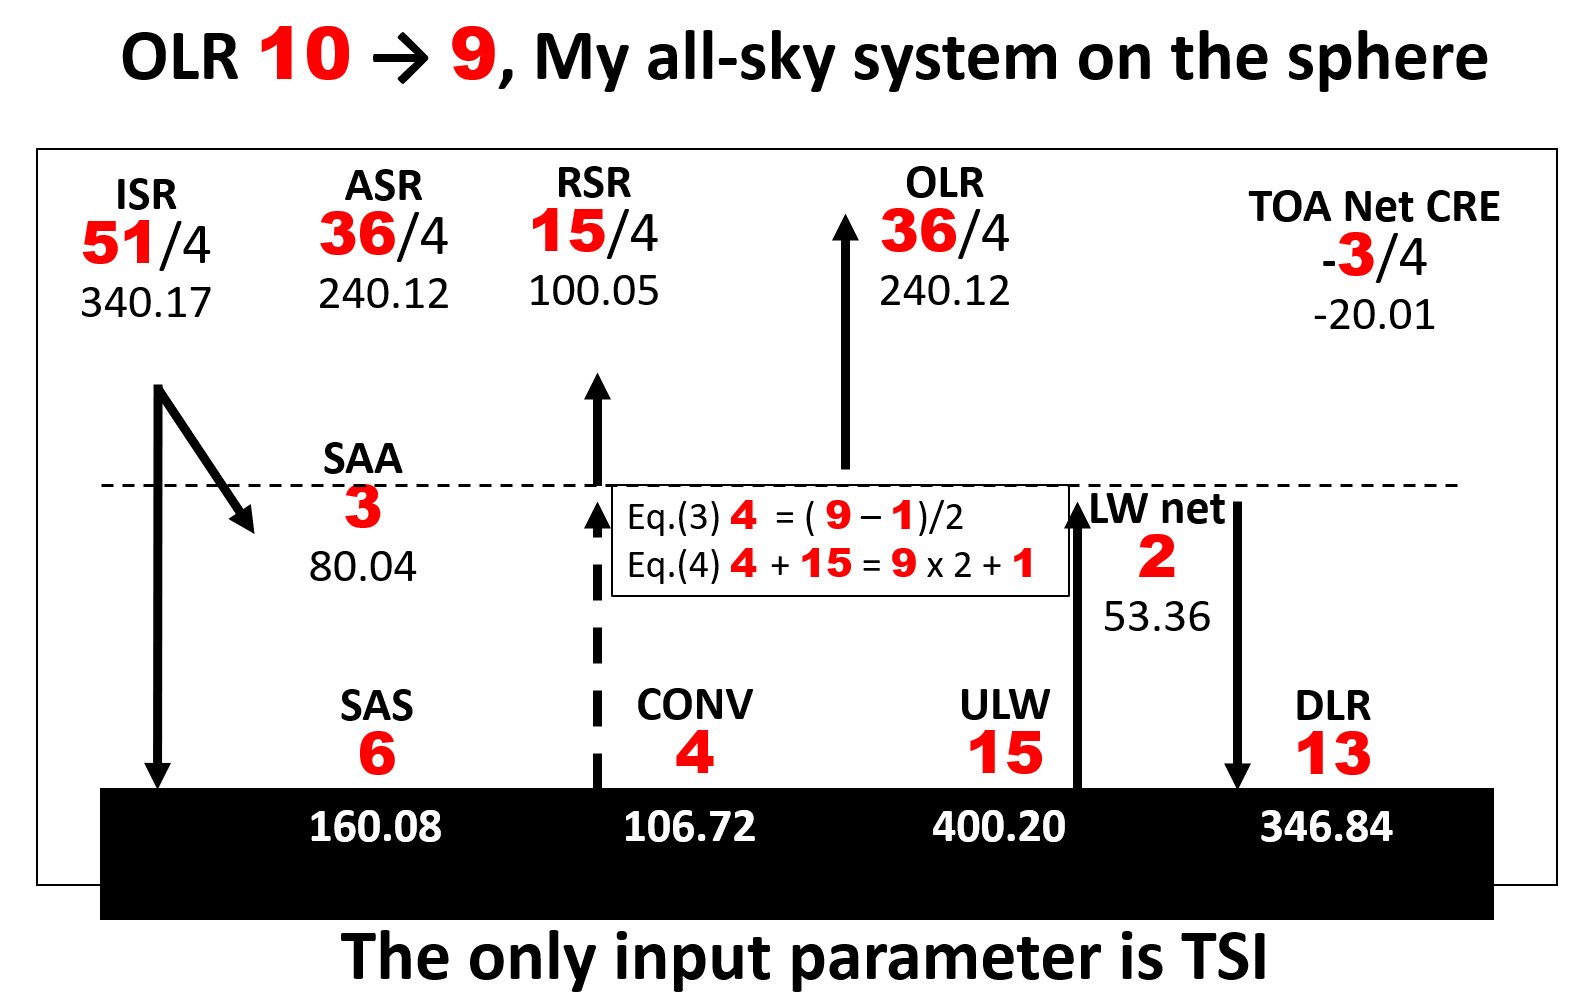
Compared to data:
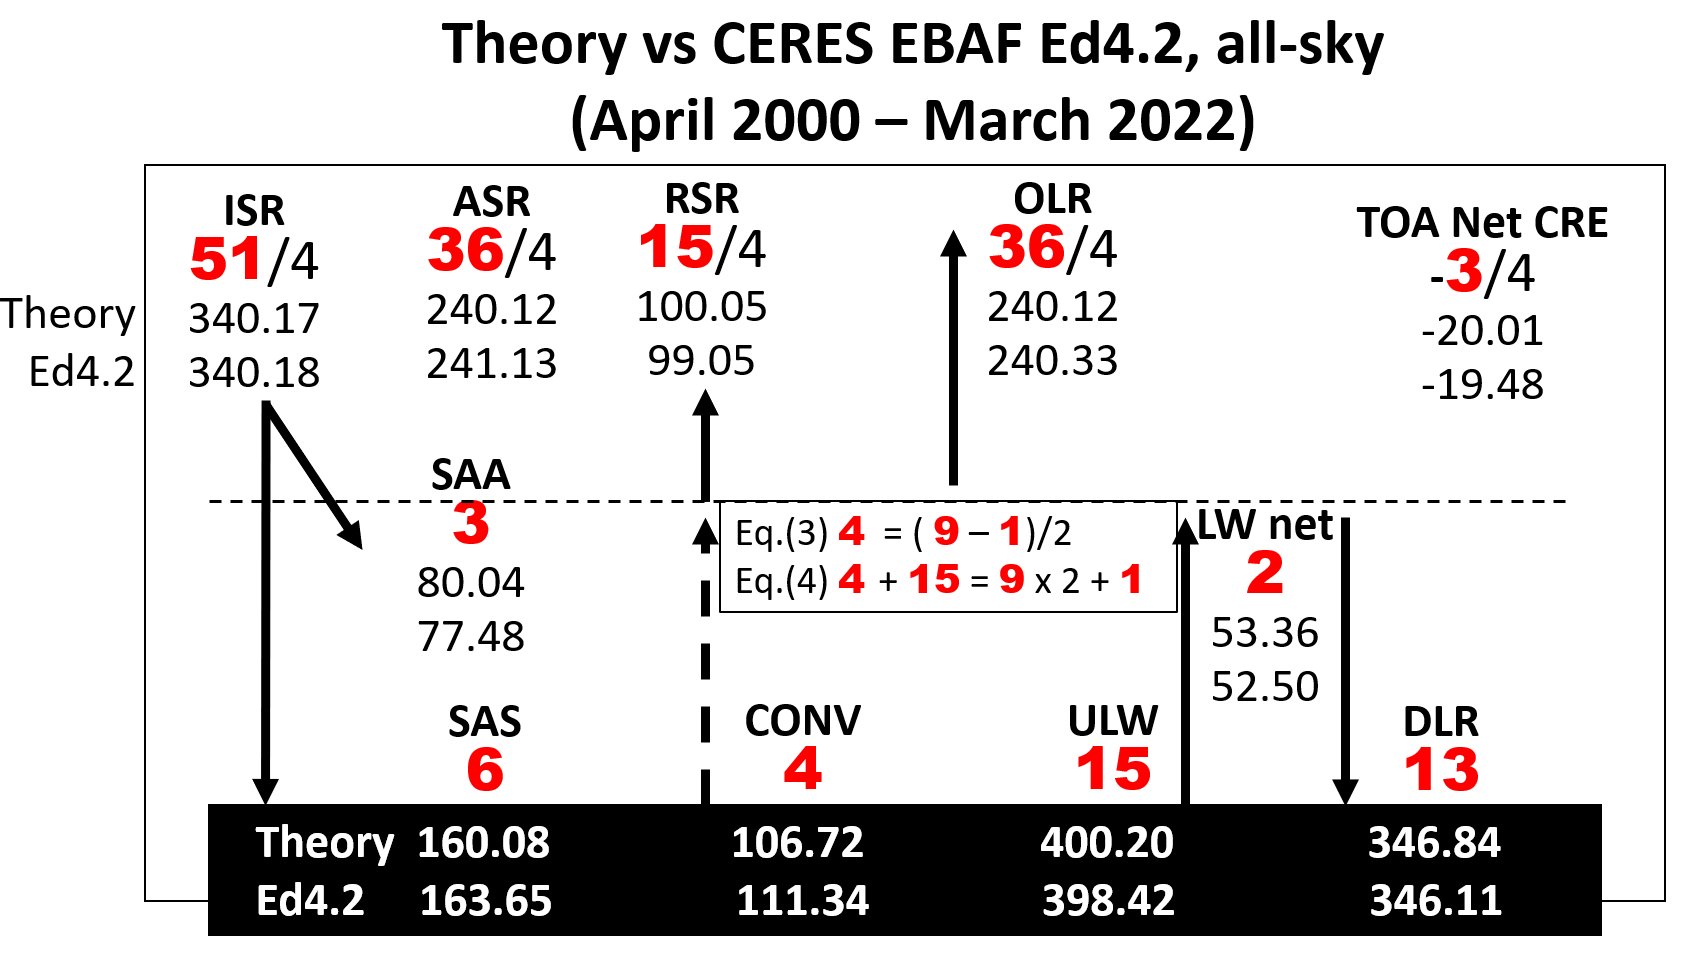
The essential climate parameters:
TSI = 51 units
Planetary albedo at TOA (integer model) = 15/51 = 5/17 = 0.294
Planetary emissivity (transfer function) = 9/15 = 0.6.
It seems the assumption on solar reflection was true.
The author of this webpage finds this observation the most exciting result of his whole research.
Compare to data from CERES Data Quality Summary tables:
See also our presentation at the CERES Science Team Meeting, Spring 2022:
https://ceres.larc.nasa.gov/documents/STM/2022-04/28_Zagoni_Data_versus_Theory_Spring_2022_v3.pdf
Go to the next page "Back to Fourier" or jump back to the main "index" page.